


Mulakan perjalanan dagangan anda dengan Skilling!
76% akaun CFD runcit kerugian wang.

Apakah corak candlestick?
Dipanggil kerana mereka kelihatan seperti - anda meneka - batang lilin. Corak candlestick ialah cara kegemaran ramai pedagang untuk melihat pergerakan harga (saham atau komoditi, untuk contoh). Candlestick telah dicipta di Jepun pada tahun 1700-an dan oleh itu sering dikenali sebagai kandil Jepun (bagi mereka yang berminat dengan sejarah mereka, mereka dipopularkan di barat oleh seorang lelaki bernama Steve Nisson).
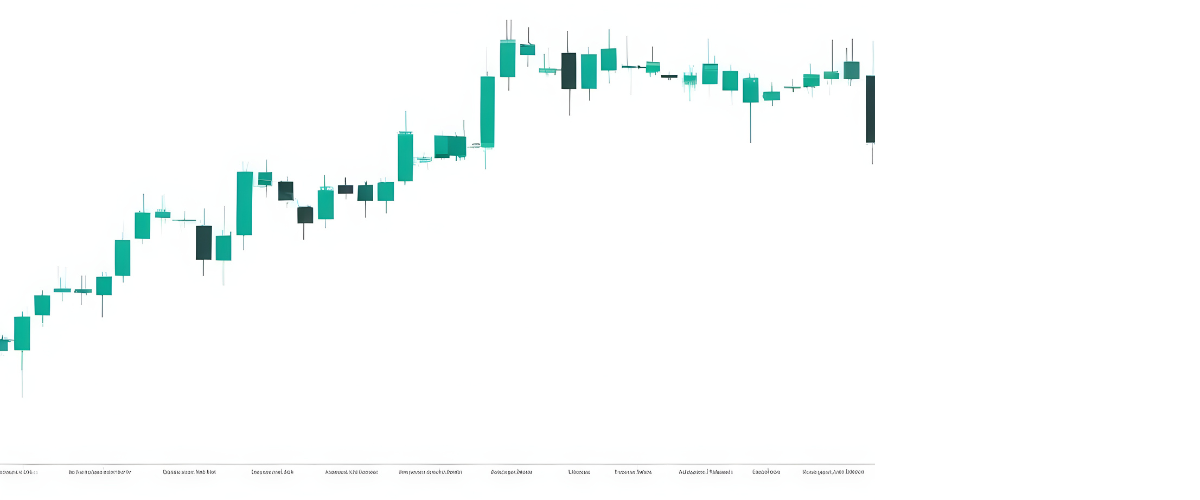
Melihat pertama pada carta, kita dapat melihat bahawa setiap batang lilin mengisahkan tentang harga emas pada masa itu. Mari kita lihat lebih dekat dua daripadanya di bawah.

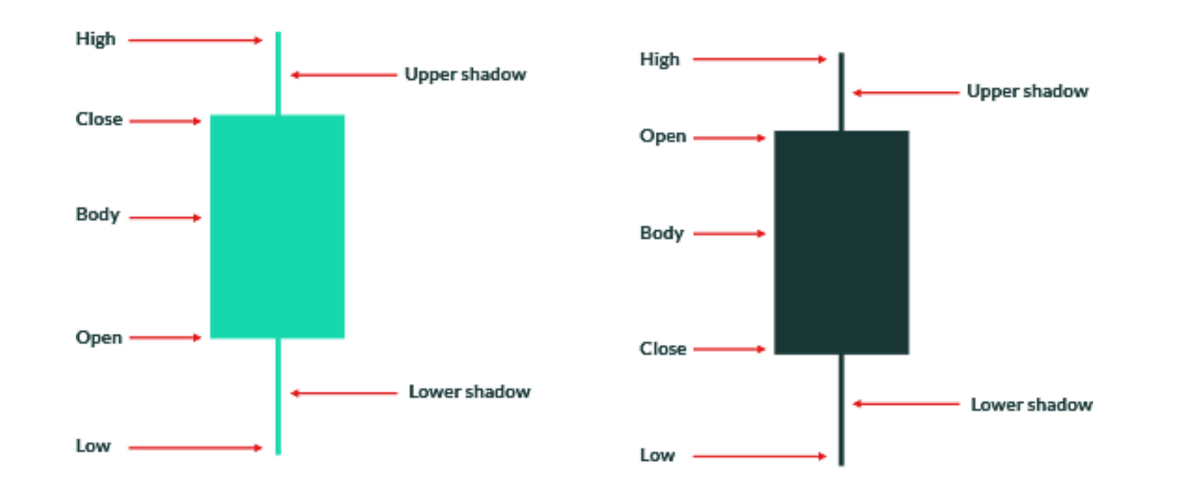
Apa yang perlu diperhatikan
- The garis menegak menunjukkan harga tertinggi (di bahagian atas batang lilin) dan harga terendah (bahagian bawah batang lilin, juga dikenali sebagai 'sumbu').
- The
warna batang lilin menunjukkan anda ke arah mana pasaran berada
pergi. Batang lilin gelap menunjukkan harga jatuh, manakala cahaya
candlestick menunjukkan harga yang semakin meningkat.
- The
harga buka dan tutup ditunjukkan oleh tepi 'badan'
batang lilin. Ini membantu anda mengetahui betapa tidak menentu pasaran. A panjang
body menunjukkan bahawa terdapat perbezaan besar antara harga buka dan tutup
jadi pasaran tidak menentu, manakala badan pendek menunjukkan terdapat sedikit
pergerakan harga.


Terdapat banyak formasi dan corak kandil, apa yang mereka boleh bentuk juga mungkin menunjukkan perubahan atau penerusan arah aliran.
Beberapa formasi candlestick memberikan banyak maklumat tentang mereka sendiri, jadi peniaga memberi lebih perhatian kepada mereka. Di bawah kami menyenaraikan beberapa formasi yang lebih terkenal, tetapi sila lihat bahagian lain dalam Skilling artikel perdagangan untuk lebih.

1. Doji
Doji terbentuk apabila harga pembukaan dan penutupan Lilin betul-betul sama, atau hampir sama. Maksudnya ada yang signifikan persamaan antara pembeli dan penjual. Ia sering dijumpai di kawasan berbalik seperti sokongan dan rintangan atau bahagian bawah atau atas trend. Ia adalah penting untuk ditekankan bahawa Lilin Doji tidak bermakna pembalikan dengan sendirinya, ia bermakna keraguan di pasaran. Doji sangat popular di kalangan peniaga.
2. Doji berkaki panjang
Doji berkaki panjang mempunyai pancang atas dan bawah yang panjang hampir sama panjangnya. Doji ini menunjukkan bahawa harga banyak bergerak dalam jangka masa tertentu, tetapi hasil akhir menunjukkan sedikit perubahan daripada yang awal buka.
3. Doji Pepatung
Doji Pepatung ialah Doji dengan harga buka dan tutup di hujung tinggi bar. Borang itu kelihatan seperti 'T' dan menunjukkan bahawa penjual mendominasi tetapi pembeli menolak semula harga ke paras terbuka.
4. Doji Batu Nisan
Doji Batu Nisan terbentuk apabila terbuka, rendah dan tertutup sama dan tinggi mencipta bayang atas yang panjang. Batang lilin kelihatan seperti sebuah 'T' terbalik dan menunjukkan bahawa pembeli mendominasi penjual dan menolak harga kembali ke tahap pembukaan.
Apakah cara yang lebih baik untuk menyambut anda selain dengan bonus?
Mulakan dagangan dengan bonus $30 pada deposit pertama anda.
Tertakluk kepada terma dan syarat

Batang lilin dengan bayang-bayang panjang
Ia sentiasa baik untuk diingati bahawa batang lilin dengan bayang atas atau bawah yang panjang menunjukkan sama ada pembeli atau penjual mendominasi sesi dagangan. Kedua-dua corak ini mungkin menyerlahkan potensi pembalikan untuk harga.
tukul
Tukul mempunyai badan yang kecil, bayang bawah yang panjang, dan bayang atas yang pendek. Lonjakan lebih rendah yang panjang menunjukkan bahawa penjual menurunkan harga tetapi pembeli datang ke pasaran dan menolak harga naik semula. Paras rendah tukul menunjukkan bahawa penjual kekal dalam pasaran. Ia adalah corak pembalikan kenaikkan harga. Di samping itu, tukul boleh menandakan bahagian bawah atau paras sokongan yang membantu untuk menetapkan tahap stop loss .

Penukul dan inverted hammer adalah corak biasa yang digunakan oleh pedagang untuk mengenal pasti potensi titik pembalikan dalam pasaran. Bentuk corak ini agak serupa, tetapi mereka mempunyai satu perbezaan utama yang membezakannya:
Baca lebih lanjut tentang batang Inverted hammer di sini.
Bintang penembak
Bintang jatuh mempunyai badan yang kecil, bayang atas yang panjang dan bayang bawah yang kecil. Batang lilin ini menghala ke arah potensi pembalikan penurunan harga atau tahap rintangan, tetapi memerlukan pengesahan sebelum tindakan. Lilin yang terbentuk selepas bintang jatuh adalah yang mengesahkan lilin bintang jatuh.

Cara menggunakan batang lilin pada saham
Corak candlestick sering digunakan oleh pelabur untuk mengesan prestasi saham. Setiap batang lilin mewakili pergerakan harga saham dalam tempoh masa tertentu, biasanya satu hari. Batang lilin terdiri daripada badan dan dua sumbu, dengan badan mewakili harga pembukaan dan penutupan saham, dan sumbu mewakili harga tertinggi dan terendah yang dicapai dalam tempoh tersebut. Candlestick boleh sama ada bullish atau bearish, bergantung pada sama ada harga saham ditutup lebih tinggi atau lebih rendah daripada harga dibuka.
Contohnya, batang lilin menaik untuk AMC Entertainment Holdings (AMC) akan menunjukkan bahawa harga saham meningkat pada siang hari, manakala batang lilin menurun untuk GameStop (GME) akan menunjukkan bahawa harga saham jatuh pada siang hari. Corak candlestick boleh memberi pelabur gambaran ringkas tentang prestasi saham dan boleh digunakan untuk membuat keputusan beli atau jual.
Ringkasan
Batang lilin Jepun adalah satu lagi bahagian penting dalam analisis teknikal. Banyak platform dagangan yang menyediakan carta, lalai untuk memilih batang lilin sebagai cara untuk melihat tindakan harga. Walaupun terdapat banyak cara lain untuk menggambarkan carta, seperti carta bar biasa, kami di Skilling menyukai batang lilin.
Walau bagaimanapun, mesti dikatakan bahawa ramai peniaga lain menggunakan pelbagai kaedah yang berbeza, jadi terpulang kepada anda untuk menggunakan perkara yang paling anda selesa dan apa yang memberi anda maklumat yang anda lakukan (atau tidak) perlukan. Walau apa pun, anda akan menjumpai kandil pada satu ketika jadi sudah pasti idea yang baik untuk menjadi agak berpengetahuan tentangnya.
Alami platform pemenang anugerah Skilling
Cuba mana-mana platform dagangan Skilling pada peranti pilihan anda merentas web, android atau iOS.


