Loading...
Qualcomm Stocks
[[ data.name ]]
[[ data.ticker ]]
[[ data.price ]] [[ data.change ]] ([[ data.changePercent ]]%)
Low: [[ data.low ]]
High: [[ data.high ]]
About
History
Competitors
About
History
Competitors
Qualcomm Inc (QCOM.US) is a leading global semiconductor and telecommunications equipment company. It specializes in the design, development, and commercialization of advanced wireless technologies, including 5G, LTE, and IoT solutions. With a current market cap of $128.96 billion, it is a major player in the technology industry.
Founded in 1985 by Irwin M. Jacobs, Andrew Viterbi, and six others, Qualcomm has a rich history of innovation in wireless communications. It pioneered CDMA technology, which became a global standard for digital cellular communications. In 1991, it went public and has since experienced significant growth and success. The company has diversified its product portfolio, expanded into various markets, and established itself as a key player in the telecommunications industry. Today, Qualcomm continues to drive advancements in wireless technology, enabling connectivity and empowering industries worldwide.
Qualcomm's stock has shown both upward and downward trends, influenced by various factors such as market conditions, technological advancements, and company performance. Within the past five years, its highest stock price reached $193.58 per share in January 2022, possibly driven by strong financial performance, technological advancements, and positive market sentiment. In contrast, the lowest stock price hit $49.10 per share in January 2019, potentially due to market volatility or industry-specific challenges.
To analyze the company's share price history, traders can employ various tools and indicators. Techniques such as moving averages, Relative Strength Index (RSI), and Bollinger Bands may provide insights into the stock's performance and potential investment opportunities. Additionally, fundamental analysis, which includes examining financial statements, industry trends, and macroeconomic factors, may also provide a deeper understanding of the forces shaping the company's share price.
By combining technical and fundamental analysis, investors and traders may identify trends and potential opportunities within this dynamic market.
Before trading Qualcomm Inc (QCOM.US) stock, it's important to consider its competitors in the semiconductor industry. Some notable competitors worth considering include:
- Intel Corporation (INTC.US): A leading semiconductor company, known for its processors and other hardware components.
- NVIDIA Corporation (NVDA.US): Renowned for its advanced graphics processing units (GPUs) and artificial intelligence technologies.
- Texas Instruments Incorporated (TXN.US): A leading supplier of semiconductors for various industries, including automotive, industrial, and consumer electronics.
- Advanced Micro Devices, Inc. (AMD.US): Known for its processors and graphics cards, offering competitive alternatives to Intel and NVIDIA.
These competitors operate in the same industry as Qualcomm and may impact its market share, technological advancements, and overall performance. Monitoring their activities and understanding their strengths and weaknesses may provide valuable insights when considering trading this stock.
| Swap long | [[ data.swapLong ]] points |
|---|---|
| Swap short | [[ data.swapShort ]] points |
| Spread min | [[ data.stats.minSpread ]] |
| Spread avg | [[ data.stats.avgSpread ]] |
| Min contract size | [[ data.minVolume ]] |
| Min step size | [[ data.stepVolume ]] |
| Commission and Swap | Commission and Swap |
| Leverage | Leverage |
| Trading Hours | Trading Hours |
* The spreads provided are a reflection of the time-weighted average. Though Skilling attempts to provide competitive spreads during all trading hours, clients should note that these may vary and are susceptible to underlying market conditions. The above is provided for indicative purposes only. Clients are advised to check important news announcements on our Economic Calendar, which may result in the widening of spreads, amongst other instances.
The above spreads are applicable under normal trading conditions. Skilling has the right to amend the above spreads according to market conditions as per the 'Terms and Conditions'.

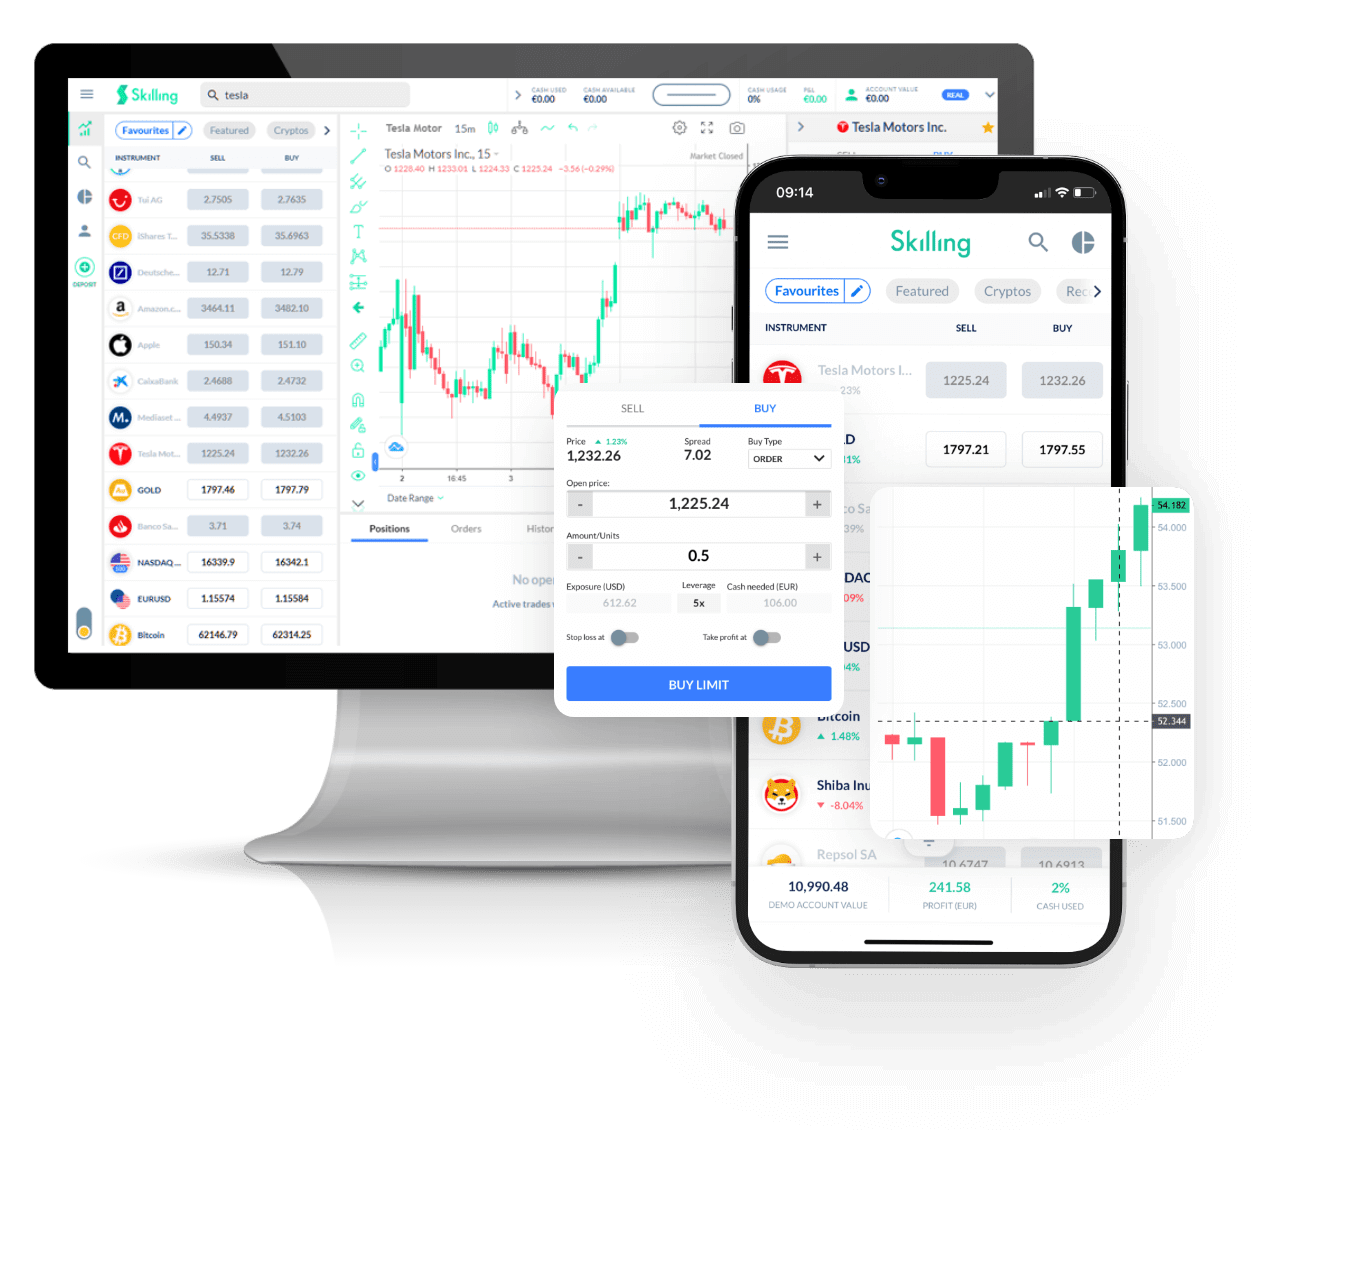
Trade [[data.name]] with Skilling
All Hassle-free, with flexible trade sizes and with zero commissions!*
- Trade 24/5
- Minimum margin requirements
- No commission, only spread
- Fractional shares available
- Easy to use platform
*Other fees may apply.
Why Trade [[data.name]]
Make the most of price fluctuations - no matter what direction the price swings and without capital restrictions that come with buying the underlying asset.
CFDs
Equities
Capitalise on rising prices (go long)
Capitalise on falling prices (go short)
Trade with leverage
Hold larger positions than the cash you have at your disposal
Trade on volatility
No need to own the asset
No commissions
Just low spreads
Manage risk with in-platform tools
Ability to set take profit and stop loss levels

