
[[ data.name ]]
[[ data.ticker ]]
[[ data.price ]] [[ data.change ]] ([[ data.changePercent ]]%)
Low: [[ data.low ]]
High: [[ data.high ]]
About
History
Competitors
About
History
Competitors
ExxonMobil (XOM.US) is a multinational energy company with a market capitalization of $426.21 billion as of July 28, 2023. Founded in 1999 through the merger of Exxon and Mobil, the company's roots date back to the late 19th century. It was founded in 1870 as Standard Oil of New Jersey, while Mobil was established in 1911 as the Standard Oil Company of New York.
Both companies played significant roles in the oil and gas industry, and their merger created one of the largest energy companies globally. ExxonMobil operates across various segments, including exploration, production, refining, and marketing of petroleum and petrochemical products. With a history of over a century, the company has maintained its position as a major player in the global energy sector, contributing to the world's energy needs.
Looking at the stock price history of ExxonMobil over the past five years, we can see that the stock reached its highest price in April 2023, when it hit $119.92 per share. This was most likely due to the strong performance of the energy sector at the time, which was driven by the growing global demand for energy. However, the stock's lowest price was in March 2020, when the global COVID-19 pandemic hit hard, and the stock reached $30.11 per share. This was a significant drop, which many investors might have seen as a good buying opportunity.
A trading strategy that traders might consider when analysing this stock could be to look out for price trend. Traders could use technical analysis tools, such as moving averages or the awesome oscillator, to identify trends over different timeframes. This could help traders identify when a stock is oversold or overbought, which could indicate a potential buying or selling opportunity.
Before starting to trade ExxonMobil stock, it's essential to consider all its competitors in the oil and gas industry. Knowing and studying industry rivals may provide valuable insight into market trends and dynamics, enabling you to make more informed trading decisions. They include:
- Chevron Corporation (CVX.US): Chevron, an energy major, operates in over 180 countries and is involved in all aspects of energy production, including exploration, production, refining, and marketing. Additionally, Chevron has a diversified portfolio, including renewable energy.
- Royal Dutch Shell (RDS-B.US): Shell is another global leader with operations in over 70 countries, offering services in gas, oil, and chemical production. Similar to Chevron, Shell's diversification into renewables, particularly wind and solar power, makes it a more attractive long-term investment.
Other competitors you might consider are: BP (BP.US) and ConocoPhillips (COP.US).
| Swap long | [[ data.swapLong ]] points |
|---|---|
| Swap short | [[ data.swapShort ]] points |
| Spread min | [[ data.stats.minSpread ]] |
| Spread avg | [[ data.stats.avgSpread ]] |
| Min contract size | [[ data.minVolume ]] |
| Min step size | [[ data.stepVolume ]] |
| Commission and Swap | Commission and Swap |
| Leverage | Leverage |
| Trading Hours | Trading Hours |
* The spreads provided are a reflection of the time-weighted average. Though Skilling attempts to provide competitive spreads during all trading hours, clients should note that these may vary and are susceptible to underlying market conditions. The above is provided for indicative purposes only. Clients are advised to check important news announcements on our Economic Calendar, which may result in the widening of spreads, amongst other instances.
The above spreads are applicable under normal trading conditions. Skilling has the right to amend the above spreads according to market conditions as per the 'Terms and Conditions'.
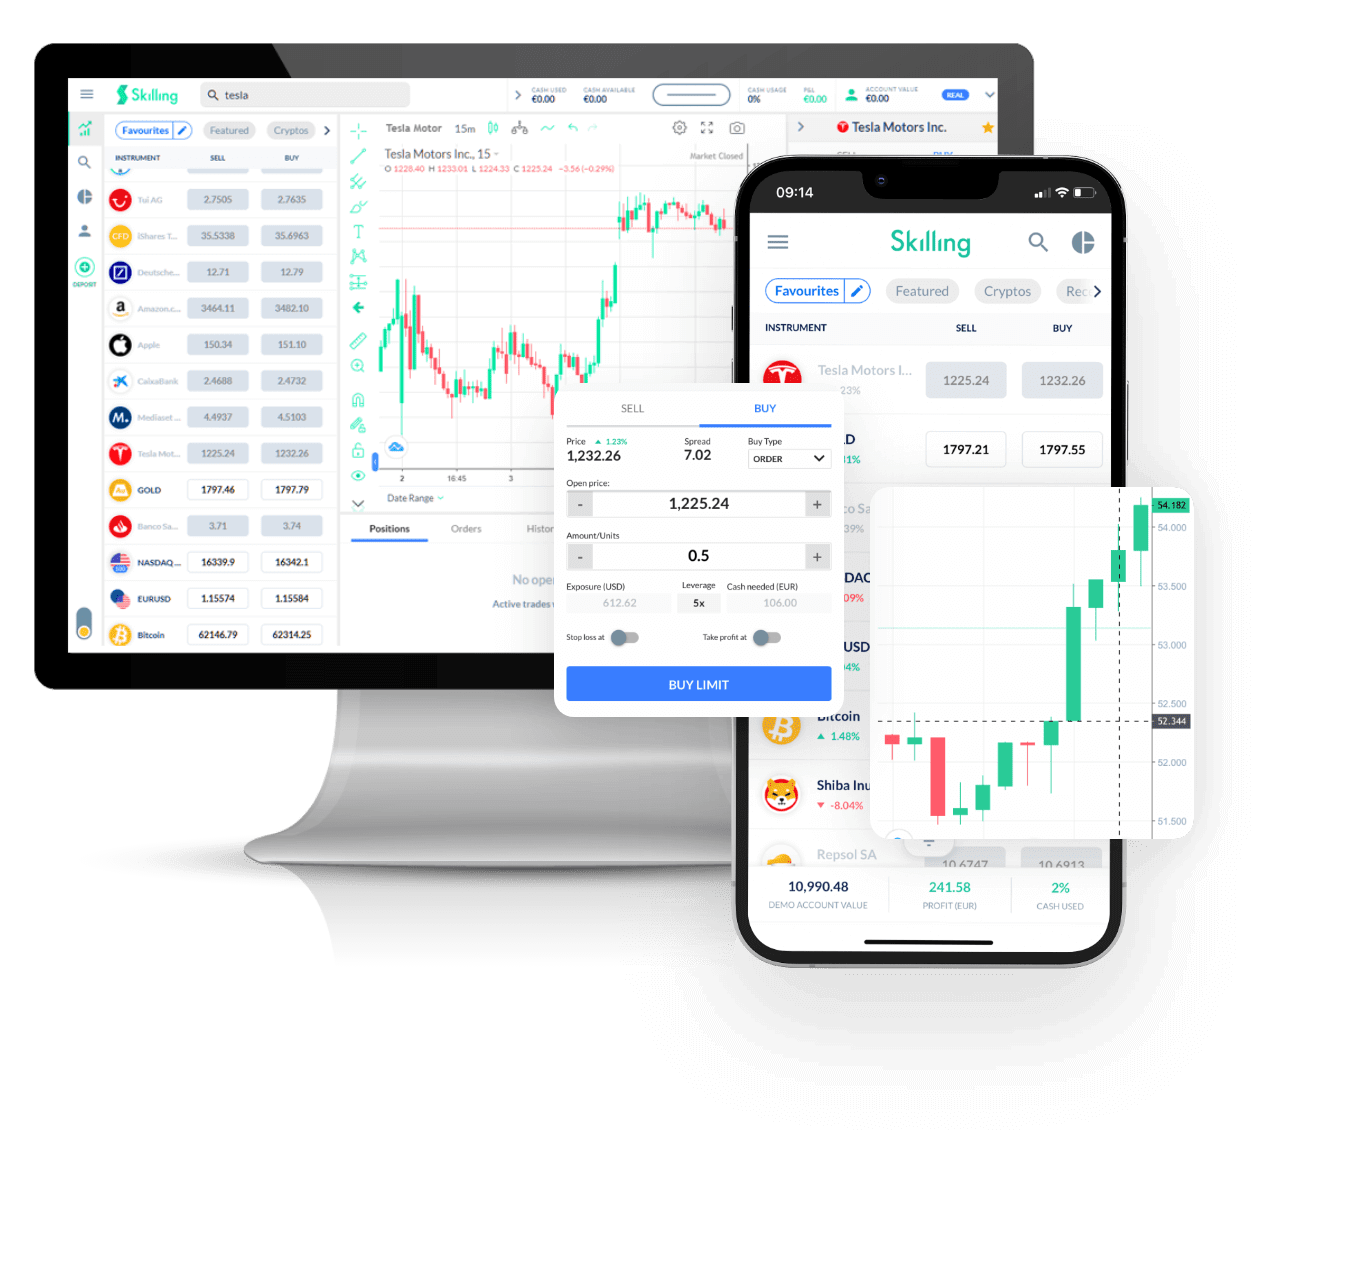
Trade [[data.name]] with Skilling
All Hassle-free, with flexible trade sizes and with zero commissions!*
- Trade 24/5
- Minimum margin requirements
- No commission, only spread
- Fractional shares available
- Easy to use platform
*Other fees may apply.
Why Trade [[data.name]]
Make the most of price fluctuations - no matter what direction the price swings and without capital restrictions that come with buying the underlying asset.
CFDs
Equities
Capitalise on rising prices (go long)
Capitalise on falling prices (go short)
Trade with leverage
Hold larger positions than the cash you have at your disposal
Trade on volatility
No need to own the asset
No commissions
Just low spreads
Manage risk with in-platform tools
Ability to set take profit and stop loss levels