
What is MACD in trading & how do you use it?
-
 Skilling Writers Team
-

-

- Education
- Technical Analysis


‘MACD’ is short for Moving Average Convergence Divergence. Invented by Gerald Appel in the 1970s, it’s a popular indicator that can be used to spot trends that help traders work out when to enter a trade.
How does the MACD indicator help traders spot potentially profitable entry and exit points? Convergence and divergence. MACD trading strategies plot moving averages on a price chart. For example, if you’re looking at MACD in stock, you’d plot two moving average lines on a share price chart. Then, depending on whether the lines move closer to each other (converge) or further away (diverge), you can make decisions.
The possible conclusions you can draw from these contrasting movements are explained later in this guide to MACD. For now, just know that converging averages suggest momentum is decreasing. In other words, the rate of change (either positive or negative) is slowing down.
If the averages are diverging, it’s a signal that momentum could be building i.e. the price is changing at a faster rate. Once you have an insight into an asset’s price momentum using the MACD indicator, you can start to make decisions on whether to buy or sell and, indeed, when to enter and exit positions.
How does MACD work?
Essentially, MACD is a trend momentum indicator that takes two moving averages and works out the difference between them. Click here for more information about moving averages. MACD turns the two moving averages into a momentum oscillator which makes it easier for the trader to visualise.
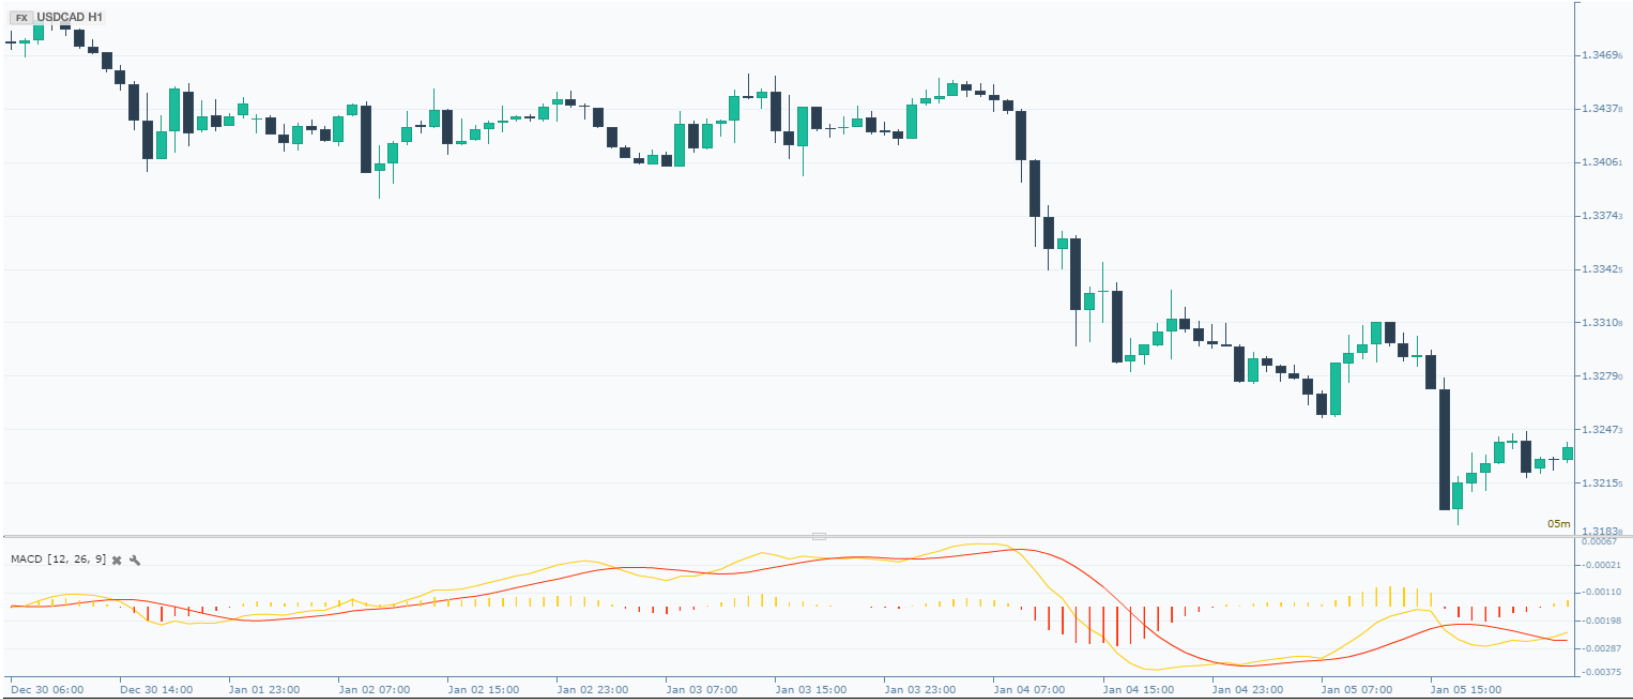
The standard MACD has three main components. To illustrate what a MACD signal looks like in practice, check out the image above. Below the main candlestick price chart, you’ll see three lines in red and/or yellow. These lines are the three components of a MACD indicator:
The MACD Line
The MACD line is shown in yellow in the example above. It can also be represented by a blue line. Whatever colour it is, this is the main point of focus. The MACD is derived by subtracting the 12-day Exponential Moving Average from the 26-day Exponential Moving Average.
The Signal Line
The red line (sometimes a dotted line) is the signal line. This is the nine bar Exponential Moving Average of the MACD.
The Histogram
The last component of the MACD indicator is the histogram. A histogram is a bar graph. You can see from the image above that it’s represented by a series of different-sized lines. These lines show the distance between the MACD and the signal. For example, if the MACD is above the signal line, the histogram (i.e. the lines on the graph) will be above the MACD line.
If the MACD is below the signal, the histogram will be below the MACD line. When the histogram is above the MACD, it suggests momentum is bullish. When it’s below, the MACD signal suggests momentum is bearish.
More MACD Signal Examples
You can use MACD in forex and when you’re trading shares. Regardless of the asset you’re trading, a MACD indicator will always feature the three components listed above. From this, you can get an idea of the direction an asset’s price is moving and how much momentum there is based on the distance between the MACD and signal.
Finally, when the two lines cross, this can be used as a signal to buy or sell. People using MACD trading strategies believe that it’s a bearish signal and time to sell when the MACD line falls below the signal. Conversely, when the MACD line rises above the signal, traders believe it’s a bullish signal and time to buy.
The following images show examples of these movements with MACD in forex and MACD in stock trading:
MACD in Stock Trading: Tesla Shares

The image above shows a crossing point just after the 16:45 mark, suggesting a bullish turn for Tesla shares. You can also see that, for a large portion of the chart, the bars on the histogram are small. This shows that the gap between the MACD and signal is small which, in turn, suggests there isn’t a lot of momentum.
MACD in Crypto: XRP/EUR

As you can see from the image above, the MACD line (in blue) drops below the signal line before the 06:00 mark, signaling bearish momentum. It quickly crosses back over and becomes bullish.
Trade Demo: Real trading conditions with zero risk
Trade risk-free on Skilling’s award winning platforms with a 10k* demo account.

How to trade with MACD
MACD is a really useful indicator for spotting short-term moves and a lot of traders use it to time their entry into the market. There are three main methods to do this:
Main MACD methods:
- When the MACD line turns down and crosses below the signal line, that signals a downward trend.
- When the MACD line turns up and crosses above the signal line, that signals an upward trend.
- As the histogram shows the difference between the two averages, it can be used to predict the strength of the trend – the bigger the histogram, most often the stronger the trend.
- As an oscillator like RSI and Stochastic, divergences may occur to foreshadow a trend reversal.
Be careful though… MACD can provide false signals like any other indicator so it’s better to use it in combination with other indicators, like RSI and Price Action.
How to add MACD
- Adding MACD to your Skilling charting platform is simple:
- First log in to the Skilling platform or sign up. Select your preferred asset from the list.
- Type MACD into the indicator dropdown menu and select MACD.
- The settings screen for the MACD are now displayed.
- You can use the default input data or enter your own. You can also change the colour settings for your MACD chart.
- Click the OK button to add the MACD to your charting platform.
MACD vs. RSI
The MACD signal is a useful way to judge the momentum of an asset. Another technical indicator that shows something similar is Relative Strength Index (RSI). The RSI gives you an indication of whether or not the market might be overbought or oversold. It does this by calculating an asset’s gains and losses over a specific period of time.
That’s similar to MACD. However, RSI is different because it measures price changes in relation to highs and lows. In other words, RSI looks at how the current price average compares to recent high and low points. The MACD indicator looks at price averages in relation to each other.
Therefore, people who use MACD trading strategies will also use RSI when they’re trading CFDs, shares, forex, and other financial instruments. Using both technical indicators can give you a better overview of an asset’s price movements, momentum, and how current values sit in relation to recent highs/lows.
Experience Skilling's award-winning platform
Try out any of Skilling’s trading platforms on the device of your choice across web, android or iOS.

Skilling summary
MACD is another popular indicator and one you are likely to come across often. Traders like it as it provides different ways to generate signals and also can give indications on trends. So, if you are the type of trader who would prefer to only look at one indicator when you trade, then perhaps MACD might be for you.
More resources
Enhance your knowledge of trading and refine your MACD trading strategy with these resources:
- To learn more about our trading conditions, click here.
- To learn about CFD trading and concepts such as risk management, click here.
- To learn more about leverage in trading, click here.
FAQs
1. How does the MACD work?
The MACD is calculated by subtracting the 26-period Exponential Moving Average (EMA) from the 12-period EMA. The result is then plotted on a chart with an additional line, known as the "signal line", which is a 9-period EMA of the MACD.
2. What does the MACD tell you?
A positive MACD value indicates that the 12-period EMA is above the 26-period EMA, signalling bullish momentum. A negative MACD value suggests bearish momentum. When the MACD crosses above or below the signal line, it generates buying or selling signals respectively.
3. How is MACD used in stock trading?
In stock trading, traders use the MACD to identify potential buy and sell signals. When the MACD line crosses above the signal line, it could be a good time to buy. Conversely, when the MACD line crosses below the signal line, it might be a signal to sell.
4. How can MACD be used in crypto trading?
In crypto trading, the MACD works similarly to stock trading. Traders look for the MACD line to cross the signal line to identify potential buy or sell opportunities. It can be particularly useful in volatile crypto markets to gauge short-term momentum.
5. What are some strategies for trading with MACD?
One popular strategy is the "MACD crossover," where a trader buys when the MACD line crosses above the signal line and sells when it crosses below. Another is the "MACD divergence" strategy, where if the price diverges from the MACD, it could signal an upcoming price reversal.
Are you looking to make the most out of your trading?
Our trading apps are designed to make your trading easier, faster and more efficient.
Not investment advice.
Do not stop learning about the financial markets
We’ve got a whole host of resources that are ready and waiting to educate newcomers to trading CFDs online, including:
- CFD trading account types
- Choose the trading account that suits your trading best
- CFD trading basics
- Learn the core principles of trading the financial markets using CFDs.
- CFD trading psychology
- Discover the five rules of thumb to mentally master the stock markets.
What is Forex trading?
Forex trading is the buying and selling of currencies on the foreign exchange market with the aim of making profit.Forex is the world's most-traded financial market, with transactions worth trillions of dollars taking place every day.
What are the benefits?
- Go long or short
- 24-hour trading
- High liquidity
- Constant opportunities
- Trade on leverage
- Wide range of FX pairs
How do I trade Forex?
- Decide how you'd like to trade Forex
- Learn how the Forex market works
- Open a Skilling CFD trading account
- Build a trading plan
- Choose a trading platform
- Open, monitor and close your first position


