


What are candlestick charts?
So-called because they look like – you guessed it – candlesticks. candlestick charts are many traders’ favorite way of looking at price movements (of a share or commodity, for example). Candlesticks were invented in Japan in the 1700’s and are therefore often known as Japanese candlesticks (for those interested in their history, they were popularized in the west by a chap named Steve Nisson).
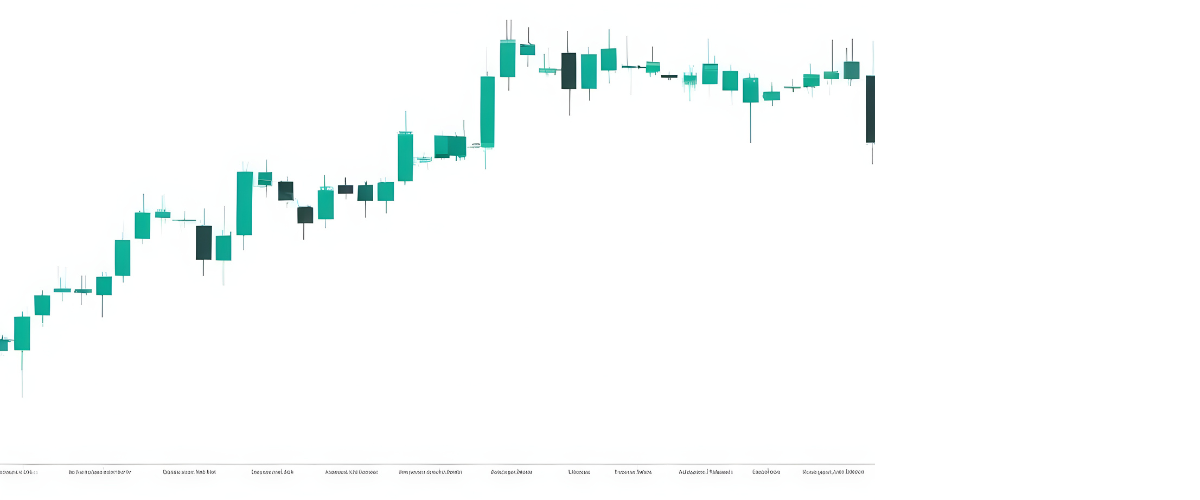
Looking first at the chart, we can see that each candlestick tells a story about the gold price at that moment in time. Let’s take a closer look at two of them below.

What to look out for
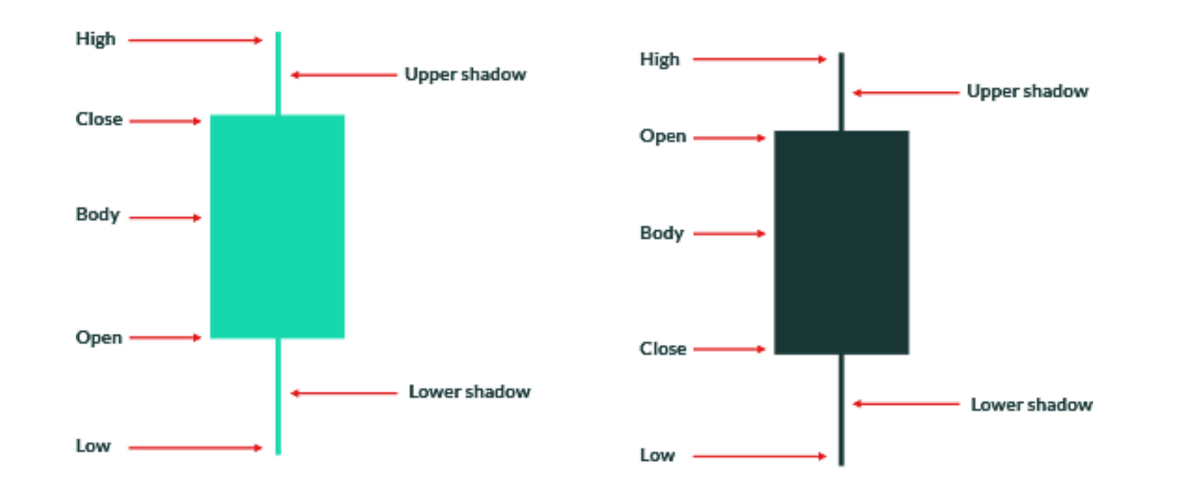
- The vertical line shows the highest price (at the top of the candlestick) and the lowest price (the bottom of the candlestick, also known as the ‘wick’).
- The
colour of the candlestick shows you in which direction the market is
going. A dark candlestick shows a falling price, whereas a light
candlestick shows a rising price.
- The
open and close prices are shown by the edges of the ‘body’ of the
candlestick. This helps you to work out how volatile the market is. A long
body shows that there’s a big difference between the open and close price
so the market is volatile, whereas a short body shows there’s been little
price movement.


There are numerous formations and patterns of candlesticks, what they can form may also indicate trend changes or continuations.
Some candlestick formations provide a lot of information on their own, so traders pay more attention to them. Below we list a few of the more well-known formations, but please see other sections in the Skilling trading articles for more.

1. Doji
A Doji forms when the open and the closing price of the Candle is exactly the same, or nearly the same. That means there is a significant equality between buyers and sellers. It is quite often found at a reversal area such as support and resistance or the bottom or top of trends. It is important to emphasise that the Doji Candle does not mean reversal by itself, it means indecision on the market. Doji’s are very popular with traders.
2. Long-legged Doji
Long-legged Doji have long upper and lower spikes that are almost equal in length. This Doji indicates that prices moved a lot within the specified timeframe, but the end result showed little change from the initial open.
3. Dragonfly Doji
A Dragonfly Doji is a Doji where the open and close price are at the high end of the bar. The form looks like a ‘T’ and indicates that sellers were dominating but the buyers pushed back the price to the open level.
4. Gravestone Doji
A Gravestone Doji forms when the open, low and close are equal and the high creates a long upper shadow. The candlestick looks like an upside down ‘T’ and indicates that buyers were dominating the sellers and pushed prices back to the opening level.
What better way to welcome you than with a bonus?
Start trading with a $30 bonus on your first deposit.
Terms and Conditions apply

Candlesticks with long shadows
It is always good to remember that candlesticks with a long upper or lower shadow indicate that either buyers or sellers were dominating the trade session. Both these patterns may highlight a potential reversal for the price.
Hammer
The hammer has a small body, a long lower shadow, and short upper shadow. The long lower spike implies that the sellers drove prices down but the buyers came to the market and pushed the price back up. The low of the hammer shows that sellers remain in the market. It is a bullish reversal pattern. In addition, hammers can mark bottoms or support levels that help to set up stop loss levels.

The hammer and inverted hammer candlesticks are common patterns used by traders to identify potential reversal points in the market. The shape of these patterns is quite similar, but they have one major difference that distinguishes them:
Read more about Inverted hammer candlesticks here.
Shooting star
The shooting star has a small body, a long upper shadow and a small lower shadow. These candlesticks point towards potential bearish reversals or resistance levels, but require confirmation before action. The candle that forms after the shooting star is what confirms the shooting star candle.

How to use candlesticks on shares
candlestick charts are often used by investors to track the performance of shares. Each candlestick represents the price movement of a share over a certain period of time, typically one day. The candlestick is made up of a body and two wicks, with the body representing the opening and closing price of the share, and the wicks representing the highest and lowest prices reached during the period. Candlesticks can be either bullish or bearish, depending on whether the share price closed higher or lower than it opened.
For example, a bullish candlestick for AMC Entertainment Holdings (AMC) would show that the stock price rose during the day, while a bearish candlestick for GameStop (GME) would show that the stock price fell during the day. candlestick charts can give investors a quick overview of how a stock is performing and can be used to make buy or sell decisions.
Summary
Japanese candlesticks are another vital part of technical analysis. Many trading platforms that provide charts, default to choosing candlesticks as the way to view price action. Although there are many other ways to visualize charts, such as regular bar charts, we at Skilling love the candlestick.
However, it must be said that many other traders use a whole range of differing methods, so it’s up to you to use what you are most comfortable with and what gives you the information you do (or don’t) need. Either way, you will come across candlesticks at some point so it’s definitely a good idea to be somewhat knowledgeable about them.
Experience Skilling's award-winning platform
Try out any of Skilling’s trading platforms on the device of your choice across web, android or iOS.


