
Support and Resistance Trading Levels
-
 Skilling Writers Team
-

-

- Education
- Technical Analysis


Another extremely important set of terms within technical analysis is that of Support and Resistance. This is another concept that should be learnt at the start of your trading as you will find it referred to continually! Support and Resistance can best be described as graphical representations of the conflicts between supply and demand within any given market.
So, when markets go up, there tends to be more demand, at a Resistance level demand and supply balance their power and when markets go down, there tends to be more supply, at a Support level supply and demand balance their power. Plotting these on a chart, the terms given are Support and Resistance. Let’s look at both more closely:
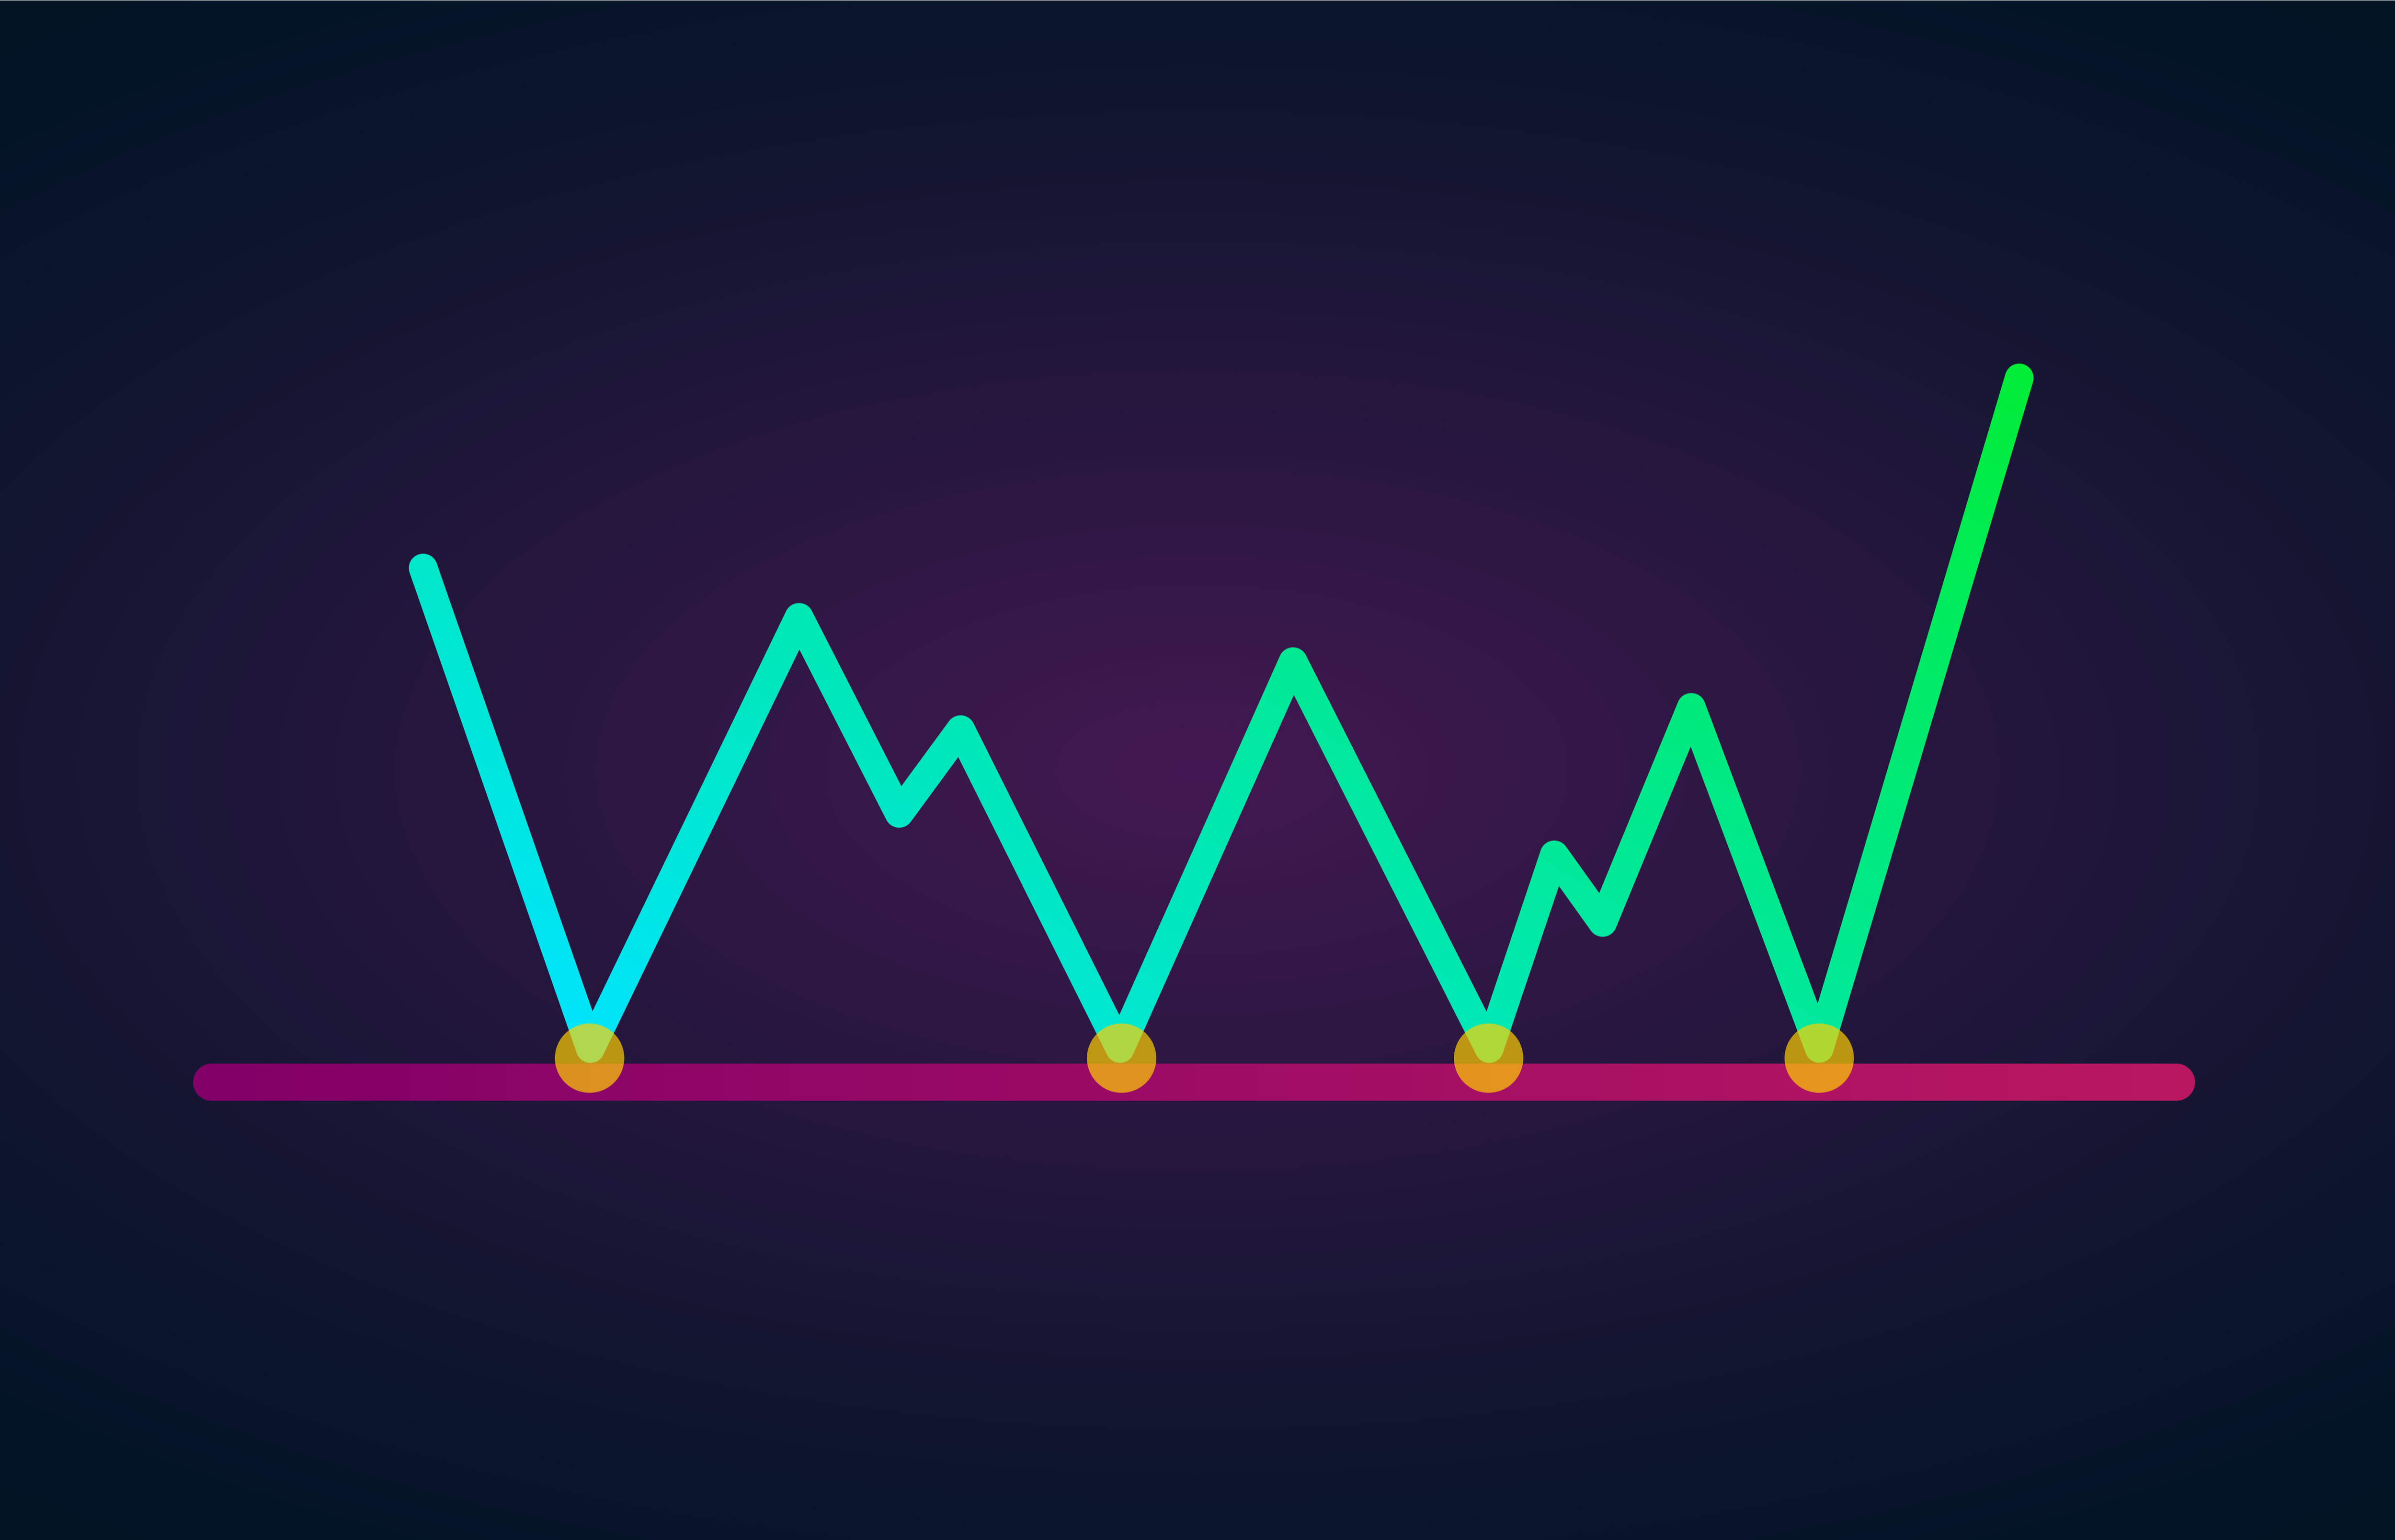
Support
Support is a level where the price tends to be prevented from declining further from the level and the demand (buy side) is thought to be strong enough to uphold the price. It is a line drawn under major lows.
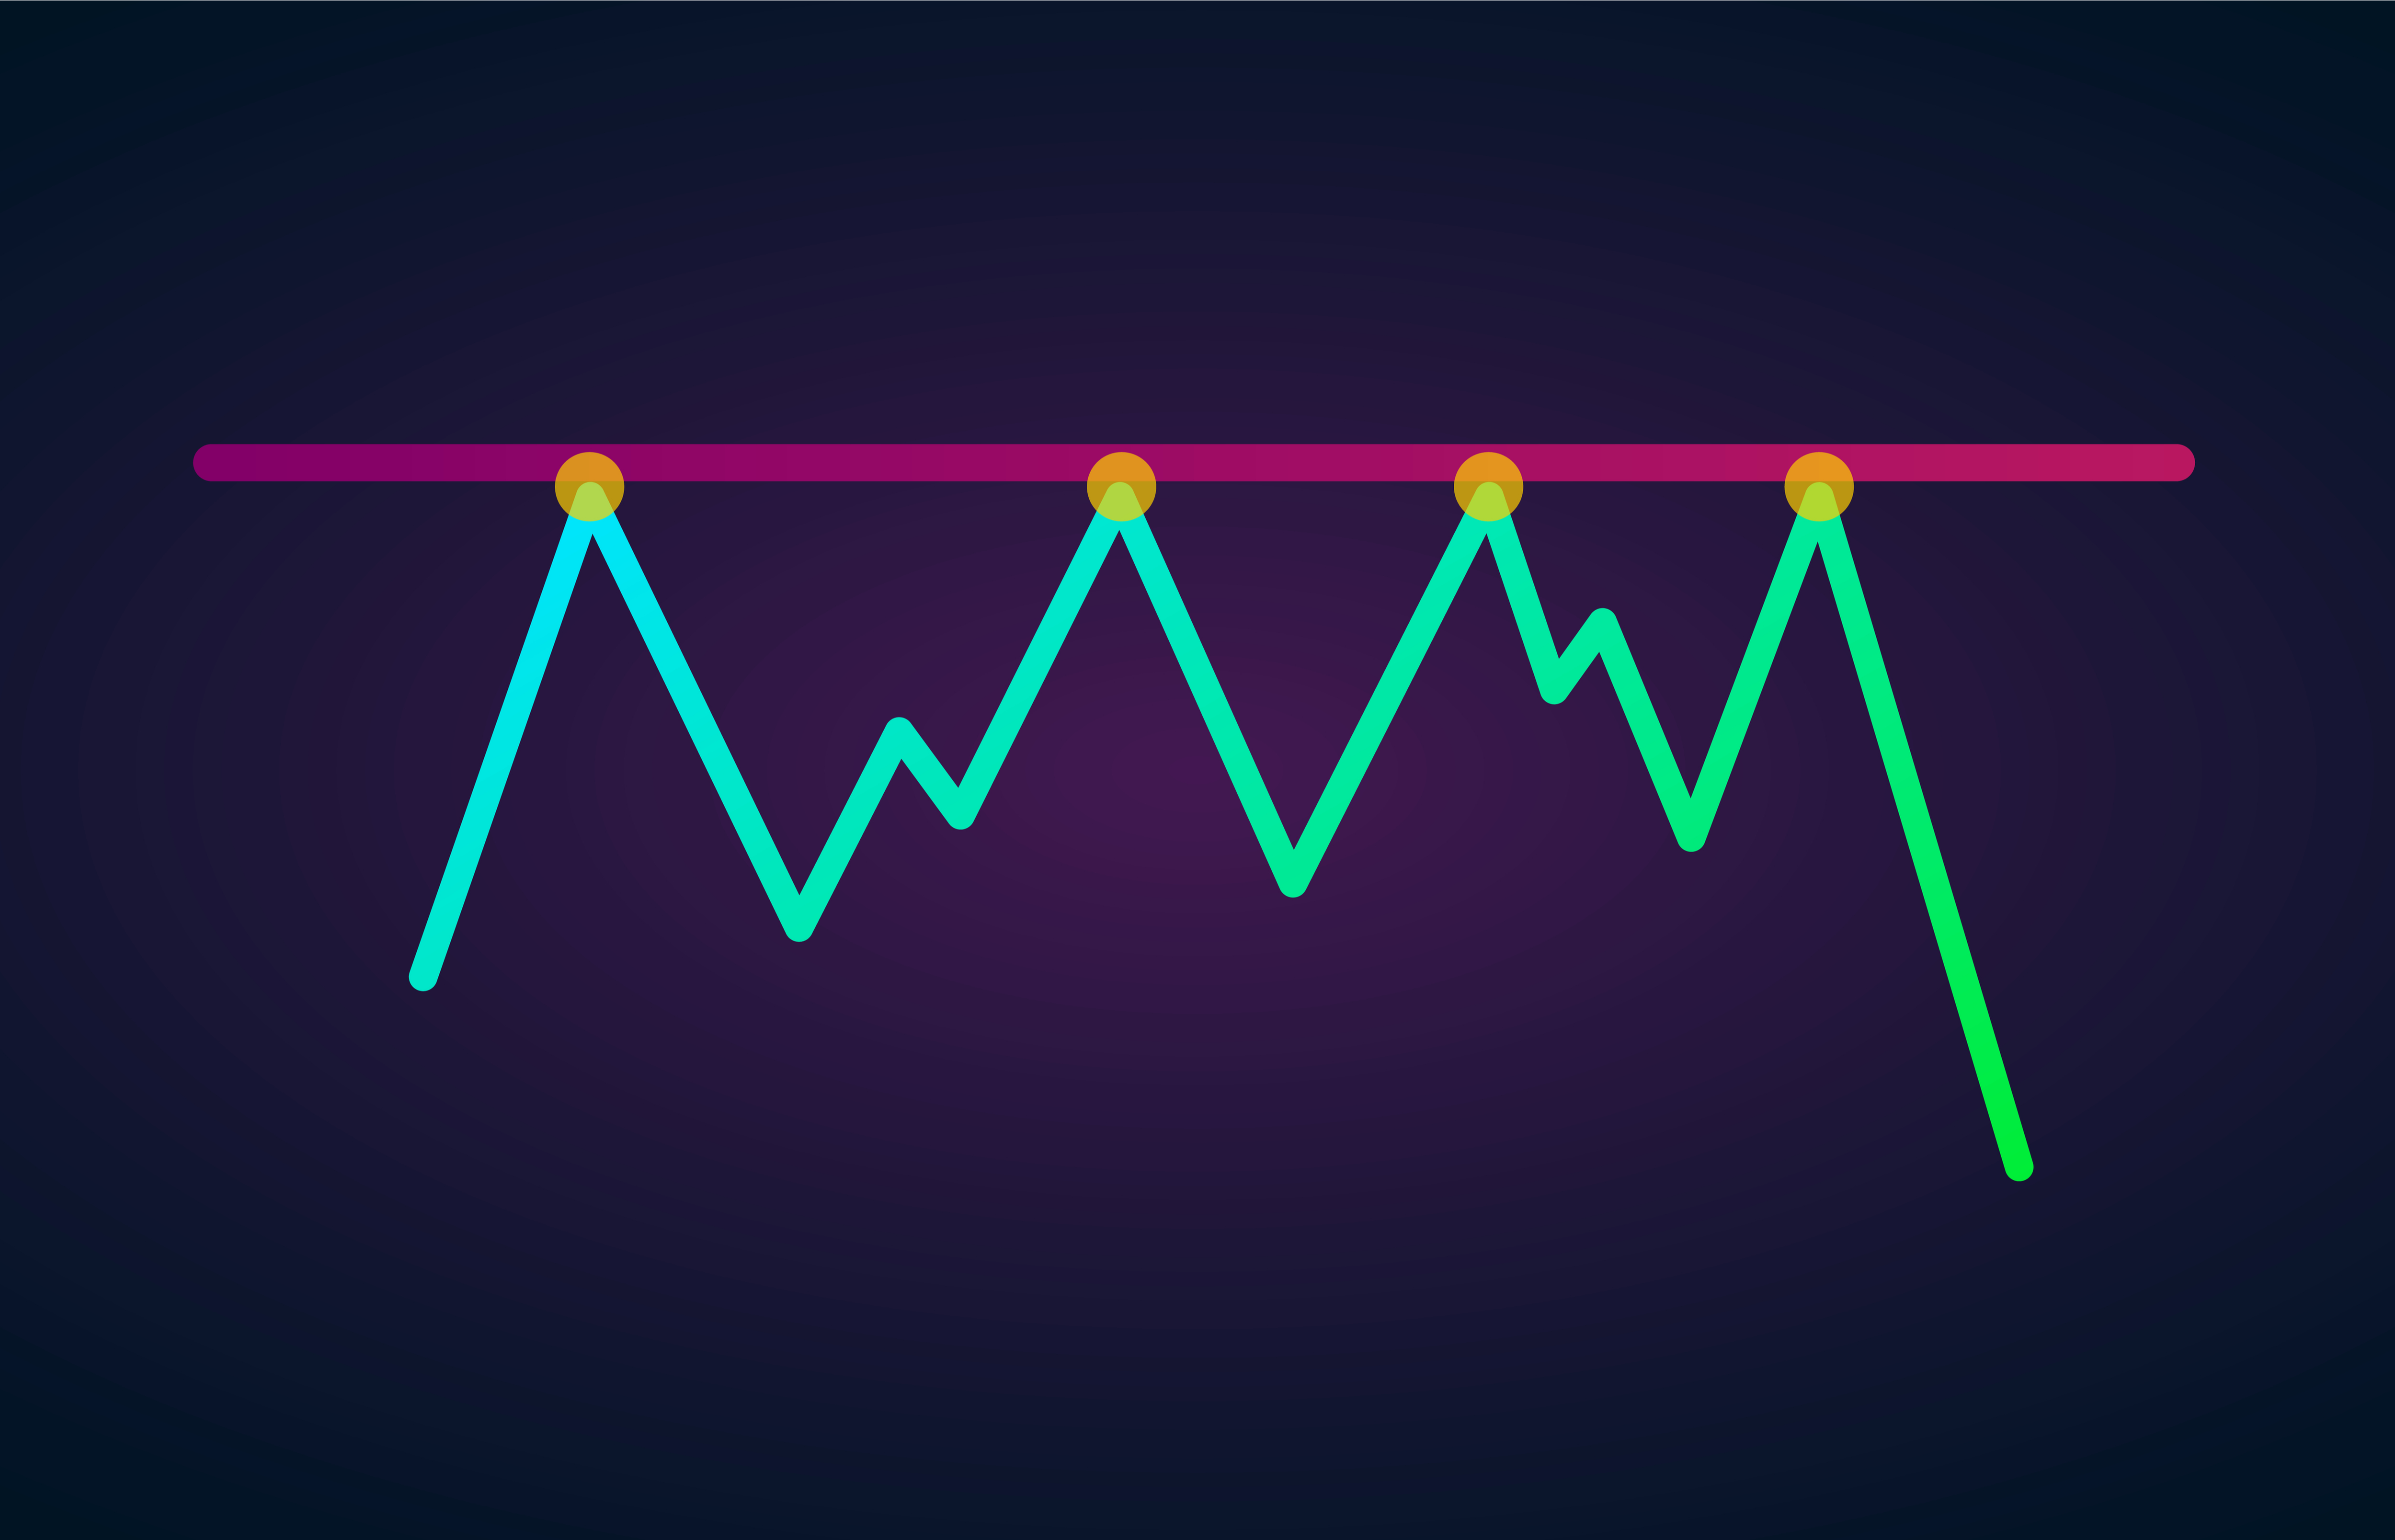
Resistance
Resistance is where the price tends to be prevented from rising further through the level because the supply (sell side) is strong enough to hold the price at, or below, that level. It is a line drawn above the major highs.
You can identify Support and Resistance levels by using pivot point levels, moving averages, or, most commonly, by simply marking levels in the past where the price had a difficult time breaking through.
Trade Demo: Real trading conditions with zero risk
Trade risk-free on Skilling’s award winning platforms with a 10k* demo account.

Interpretation of Support and Resistance
The general rule is, the more often a Support or Resistance level is tested (i.e. bounced off or away from), the more significant the level becomes. And of course, the more times it happens, the more people to stand up and take notice of that level.
Why does this happen though and what is the psychology of Support and Resistance levels? Well, traders who are long, expecting a rise in price, may consider placing a new buy order(s) if the price drops back down to the same Support level. Traders who are short, may buy ‘to cover’ their position at the same Support level.
Keep in mind, if most of the market’s participants actually buy at this level, prices will rebound from the Support. Of course, it can happen in the opposite way, too. If the price breaks through the Support level, long traders may wait for prices to climb back up to the previous Support level, which will now act as Resistance, to hedge or close their position. At this time, short traders may consider adding a new position(s) at the new Resistance level.
For some reason, which can only be logically attributed to psychology, Support and Resistance can also often be seen at big whole numbers. So, for example, let’s say there is a price level of 1.20 in GBP/USD. Often a whole number like that will be used as a Support or Resistance level - probably because traders have set a lot of take profits or stop loss orders here which can affect the inability to break through the level. Have a look at some charts and we are sure you can notice the pattern!
Important indicators
Support and Resistance are two very important levels in terms of trend identification since an uptrend will tend to break through previous resistance levels to make higher highs while a downtrend will break through the previous support levels under the market to make lower lows.
When the support line below the recent major low is broken in an uptrend, it indicates that the uptrend is weakening and may reverse soon. Similarly, when the recent resistance line in a downtrend is broken, it indicates that the trend is weakening and that a trend reversal may occur. When a Support or a Resistance line is broken, it often inverses to become a Resistance or Support line for future price movements.

Skilling Summary
Support and Resistance levels are a definite requirement for any serious trader. They form one of the key parts of understanding technical analysis. They are also an easy concept to understand, and many such areas can be spotted on charts without the need of even drawing a line. We feel that Support and Resistance is one area where you should spend a good amount of time studying, so that you become proficient in recognising these key levels. Support and Resistance lines are easy to draw through the Skilling platform.
Are you looking to make the most out of your trading?
Our trading apps are designed to make your trading easier, faster and more efficient.

Not investment advice. Past performance does not guarantee or predict future performance.


