
Different Types of Chart Patterns and How to Read Them
-
 Skilling Writers Team
-

-

- Education
- Trading


Chart Patterns
Once you are good at identifying trend lines, support and resistance levels, you can take the next step and start to learn about the various Chart ‘Patterns’. Patterns are basically graphical images of price formations on charts, so that they can be classified into different categories and which then have predictive value. The two major groups of Chart Patterns are reversals and continuation patterns. Reversal patterns indicate that an important change in trend may be occurring, whilst continuation patterns show that the market is pausing for a period of time (consolidation of trend) but that it might resume its existing trend.
There are several well-known reversal and continuation Chart Patterns, here are some of them.
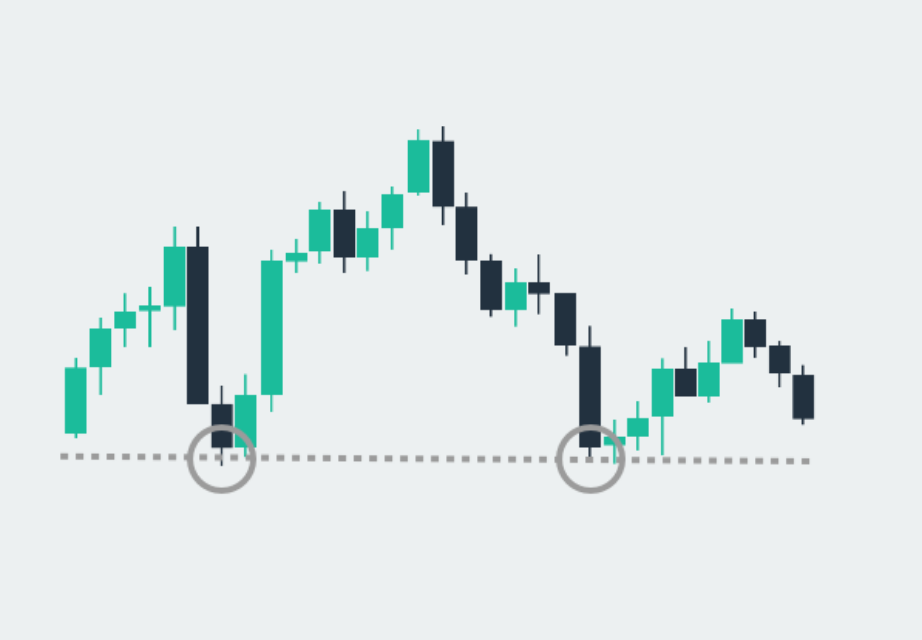
Head and Shoulders Pattern
This pattern is one of the most reliable patterns out there, making it very popular with technical analysts. It’s called a Head and Shoulder pattern predictably because it looks like a head and shoulders.
The Head and Shoulders pattern suggests that the market is perhaps about to reverse its current trend. So, if you see this setup in your charts, it could mean prices have peaked and are about to fall indicating a shorting opportunity.
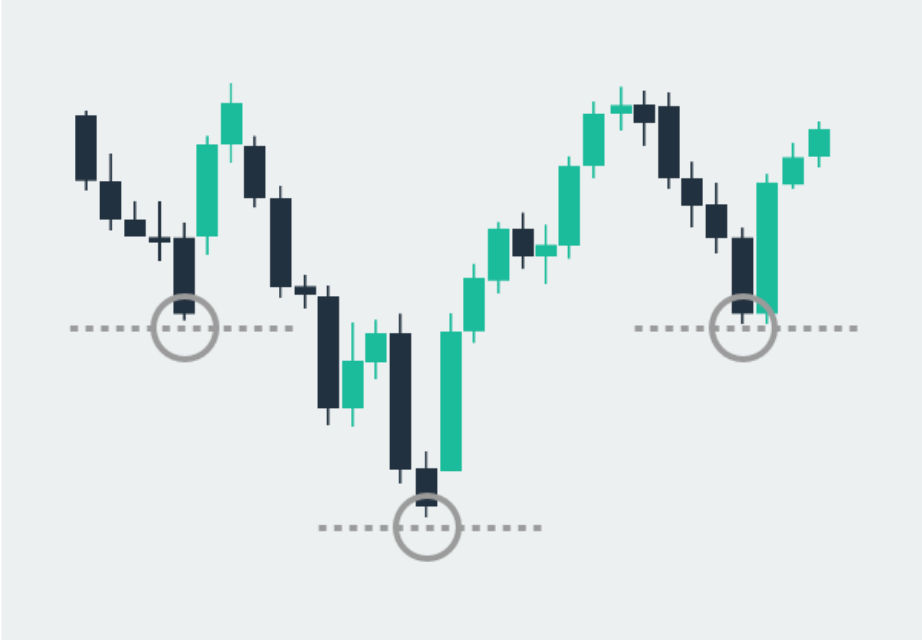
Inverted Head and Shoulders Pattern
The opposite of this setup is called the Inverted Head and Shoulders pattern, which could mean that the price has hit a bottom and is about to reverse.
The key components of a Head and Shoulders pattern are the head, shoulders and neckline (see pictures). Each pattern must have two shoulders and one head just like a human body. These are usually fairly easy to spot although there will never be a 100% ideal setup and traders must use their judgement.
Trade Demo: Real trading conditions with zero risk
Trade risk-free on Skilling’s award winning platforms with a 10k* demo account.

The neckline is the key feature of a Head and Shoulders chart as it tells you when to potentially make your trade. It’s drawn by connecting the two lowest points in the troughs or, for an Inverted Head and Shoulders pattern, the two highest points in the two peaks.
When the price breaks through the neckline according to Technical Analysis (TA) theory it’s time to pull the trigger and make your trade (for a sell). If everything goes as planned, you’ll be able to profit from a trend reversal.
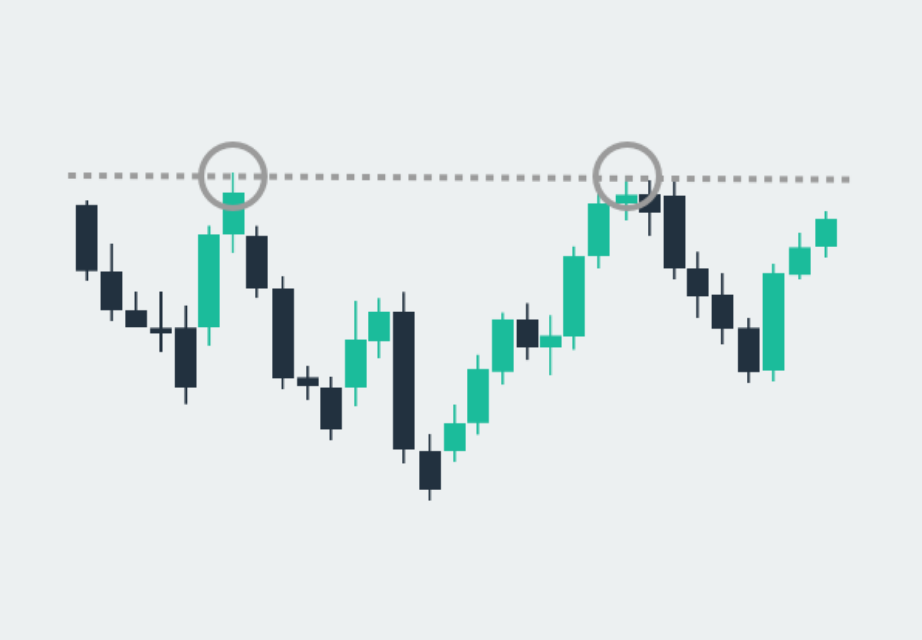
Double Top and Double Bottom
Like candlestick patterns, the shooting star and inverted hammer, this pair of popular chart patterns can also help you spot a reversal in a market trend.
Double Top Pattern
A Double Top is when a price has hit a second peak and is now headed for a fall. This looks a bit like an “M” on a chart. If the price bounces two or more times from that level, then you will have the two ‘tops’ in place. With the Double Top, you can place your entry (sell) order below the neckline (low between the two tops) as you are now expecting a reversal in the uptrend.
Double Bottom Pattern
A Double Bottom is when a price has hit a second low and is now headed upwards. This looks a bit like a 'W' on a chart. It is basically the opposite of double top, so you will have valleys instead of the peaks and you will expect that the downtrend is about to end, so you would be looking to potentially go long.
You need to be careful when looking out for Double Tops and Double Bottoms; it’s important that the second peak or second bottom is close to the price level of the first one.

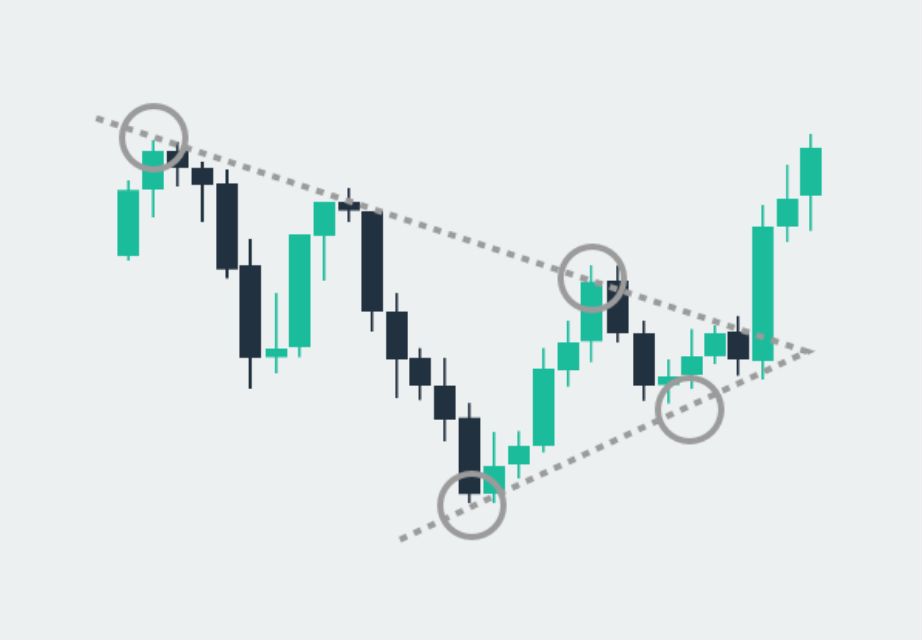
Triangle patterns
There are three kinds of Triangle Patterns you can look out for when trading. These patterns are also known as ‘continuation patterns’ because – unlike the other patterns we’ve looked at today – they indicate the continuation of a trend, or even a breakout, rather than a reversal.
Symmetrical Triangle Pattern
Firstly, you have the Symmetrical Triangle. This is formed when the price is making lower highs and higher lows. Effectively buyers and sellers are cancelling each other out and the market is narrowing to a tighter range. Eventually the price will ‘break’ and can often shoot up or down.
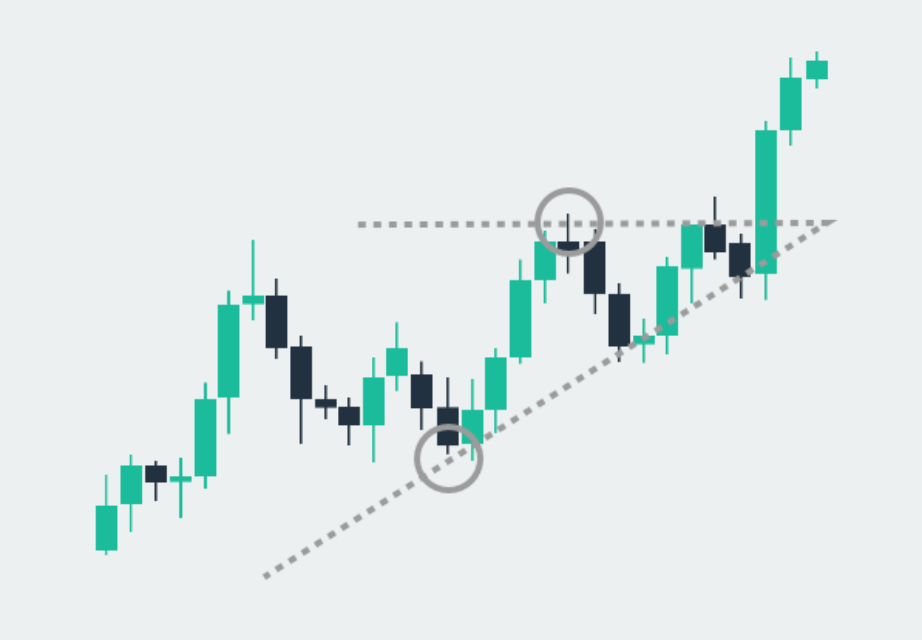
Ascending Triangle Pattern
Secondly, there’s the Ascending Triangle. This appears when the price is making higher lows but the highs are staying the same. What does this mean? It indicates that there are plenty of buyers out there but they’re not yet willing to break through a certain price.
Based on Technical Analysis (TA) theory when you see an Ascending Triangle like this it means a price rally is likely on its way.
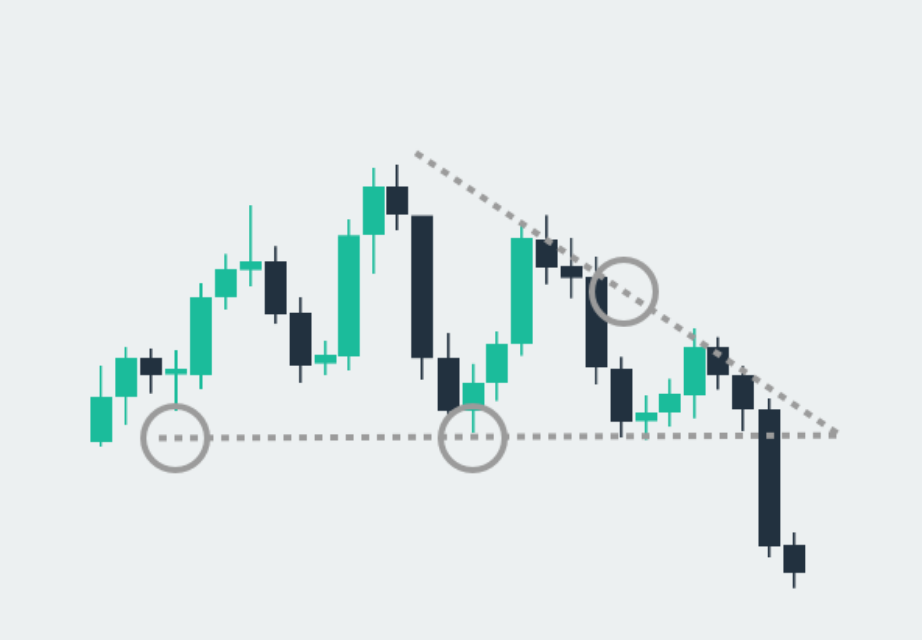
Descending Triangle Pattern
Finally, you have the Descending Triangle. This is essentially the reverse of the Ascending Triangle, with lower highs indicating a selling pressure but with sellers unwilling to go below a certain price.
The Descending Triangle can be a good indicator that prices are about to breakout into a fall.
Are you looking to make the most out of your trading?
Our trading apps are designed to make your trading easier, faster and more efficient.

Skilling Summary
Chart Patterns are the next step after you have learnt the basics. They tie together longer periods of price action and help you make sense of the bigger picture. Patterns are not necessarily for everyone (you may prefer simply to use oscillators for example) but a knowledge and understanding of them is important. They are definitely one of the most popular ways of approaching the market. The good thing about Chart Patterns is that they can occur on virtually any time frame...from short to long, so they have many applications.
Not investment advice. Past performance does not guarantee or predict future performance.


