
Continuation candlestick patterns and others explained
-
 Skilling Writers Team
-

-

- Education
- Trading


Candlestick patterns
Every trader has at some point encountered this scenario: You've spent hours pouring over financial news, analysing charts, and generally keeping up with market movements. Finally, you've identified a promising trend, and you're ready to jump in. But what if that trend is more than just a temporary blip? How do you know if it's worth following for the long haul?
This is where candlestick patterns such as continuation and reversal patterns come into play.
- Reversal patterns are crucial for identifying instances when a market is poised to change direction.
- On the other hand, continuation patterns are equally important as they provide indications of the market's intention to persist in its current trend.
One particular subset within the realm of candlestick patterns that deserves attention is the category of continuation candlestick patterns.
These patterns, characterized by their ability to signal the resumption of an existing trend, play a vital role in guiding traders and investors. Recognizing and interpreting continuation candlestick patterns can empower market participants to make more informed decisions, enhancing their ability to navigate the dynamic landscape of financial markets effectively.
Reversal patterns
Engulfing candlestick patterns
The Engulfing pattern is considered to be a very strong and simple reversal pattern as it involves only two candles. The premise behind it is that the market has been moving in a direction and a trend, as signified by the first candlestick. However, the market then changes direction and engulfs the first candle within the second candlestick. This shows a change in sentiment.

As it occurs often and is easy to spot, this pattern is a very popular tool for identifying a potential turning or a reversal point. However, caution is advised because every time frame has its own larger trends and within these trends you may find turning points of the smaller trends. Choose your time frame carefully and be aware of the larger trends. Secondly, keep in mind that most patterns require confirmation. For example, when you see a reversal pattern that does not mean you have to sell automatically - the pattern is stronger when it occurs around a support or resistance area.
As seen, Engulfing patterns are made of two candlesticks, one bullish and one bearish (in whichever order). The important thing is that the second candle totally engulfs the first one. The size of the first candle is not important, however in the case of the second candle the bigger the better. The second candle will confirm for us the strength / momentum of the reversal.
If we would like to use the candlestick patterns effectively we must determine the direction of the existing trend. moving averages, recent highs and lows or trend lines will always help us to see the big moves on the market. When we combine the pattern analysis on a high timeframe with correct money management the Engulfing pattern is a very reliable charting tool.
Harami
The Harami, another popular candlestick pattern, occurs when a large bar is followed by a smaller candle whose body is located within the vertical range of the large body. The bullish Harami gives a sign of a reversal of a downward trend. While a bearish Harami highlights a turning point in an uptrend. The chances of a reversal increase when the body of the second candle is smaller or a doji.

Trade Demo: Real trading conditions with zero risk
Trade risk-free on Skilling’s award winning platforms with a 10k* demo account.

Morning Star / Evening Star pattern
These are two common patterns that look inverse to each other. The Morning Star is a bullish reversal candle pattern while the Evening Star is for a bearish turning point. Essentially, the pattern includes three candles.
Morning Star:
- The first candle is a large bear candle. Sellers are dominating the market.
- The second candle has a gap between the first and the third candle, and can be bullish or bearish. Usually the body of the candle is smaller than the others. The gap, (which is more prevalent in markets with set open and close times such as equity markets) confirms the buyers or sellers dominance.
- The third candle is a large bullish candle. The buyers came into action and it is suggesting a turning or a reversal point.
The Evening Star pattern is the opposite formation of the Morning Star.
- First candle is a long bull candle
- Second candle opens, with a gap and a smaller candle which can be either bullish or bearish. The gap does not always happen in every market condition, and it’s not a must have criteria for this pattern.
- The third candlestick selling dominates, therefore it is a large bearish candle.

The important thing to remember is that Morning or Evening Star patterns carry much more weight when they form around a supply or a demand zone, like other reversal candle patterns.
Of course, no candlestick pattern by itself is a guarantee that a market trend is going to reverse. If you’re going to make a trade based on candlestick patterns, you should always manage your risks. Read more about risk management.
Continuation patterns
Rising or Falling Three Methods
We look for the Rising Three Methods candlestick pattern in an uptrend within the context of a continuation. The Falling Three Methods happens when the trend is already bearish and the price continues to fall.
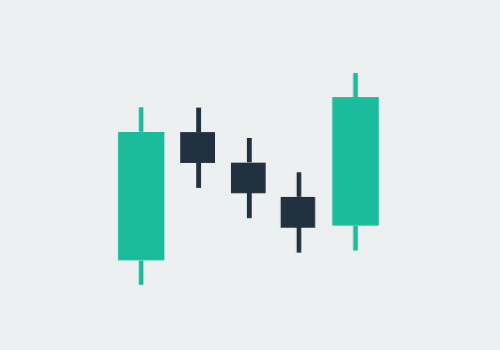
Rising Three Methods:
- The first candle of the pattern is a large bullish candle.
- The following three candles are small bearish candles. They should be within the range of the first candle of the pattern.
- The last candle of the pattern is another long bullish candle that creates a new high which suggests that the buyers are back in control.
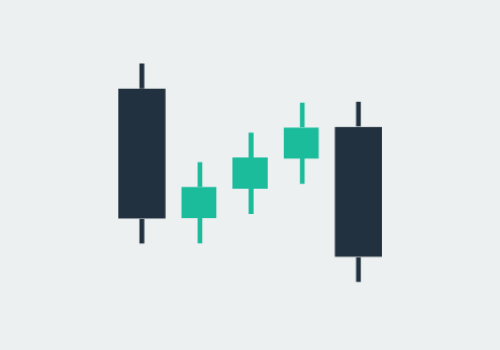
Falling three Methods:
- This is the opposite of Rising Three Methods pattern. Just reverse the logic.
- The first candle is a long bearish candlestick within the downtrend.
- Followed by small-bodied candlesticks that trades within the range of the first candlestick.
- The fifth candle is a long red candlestick which creates a new low.
What's your Trading Style?
No matter the playing field, knowing your style is the first step to success.

Final thoughts
As seen, continuation candlestick patterns and other trend identifiers are useful tools that traders could use to identify market trends and make informed trading decisions. However, it takes time and effort to master these tools, and traders should always exercise caution and risk management when trading.
If you are new to trading, we recommend starting with a Skilling demo account for free. With the demo account, you will Learn how to use various indicators and trade various instruments such as stocks, cryptocurrencies, Forex and more in the form of CFDs without risking real money.
Or you can open a Skilling account and use them on live charts.
FAQs
- What are continuation candlestick patterns?
- Continuation candlestick patterns are chart patterns that indicate a temporary pause or consolidation in an ongoing trend before it continues in the same direction.
- What are some common continuation candlestick patterns?
- Some common continuation candlestick patterns include the Rising Three Methods, Falling Three Methods, Bullish Flag, Bearish Flag, and Pennant. These patterns suggest that the current trend is likely to continue.
- How do I identify continuation candlestick patterns?
- They can be identified by specific formations of candlesticks, such as multiple small-bodied candles followed by a larger candle in the direction of the trend. Traders often look for confirmation signals and use other technical indicators for validation.
- What are reversal patterns?
- Reversal patterns are chart patterns that indicate a potential change in the direction of the current trend. They suggest that the ongoing trend may be nearing its end and could reverse.
- What are some common reversal patterns?
- Some common reversal patterns include Engulfing Candlestick Patterns, Harami, Morning Star, Evening Star, Hammer, Shooting Star, and Doji. These patterns can signify a potential trend reversal and are closely watched by traders.
- How do I identify reversal patterns?
- They are identified by specific candlestick formations, such as a large engulfing candle following a series of smaller candles or a doji indicating indecision in the market. Traders often look for confirmation signals and combine them with other technical analysis tools.
- Are candlestick patterns reliable for trading decisions?
- Candlestick patterns could provide valuable insights into market sentiment and potential price movements. However, it's important to consider other factors, such as trend analysis, volume, and overall market conditions, to make well-informed trading decisions.
Not investment advice. Past performance does not guarantee or predict future performance.


