


什么是k线图?
之所以这么叫,是因为它们看起来像——你猜对了—— 蜡烛图。k线图是许多交易者最喜欢的观察方式 价格变动(股票或商品的价格变动,例如 例如)。蜡烛图是 18 世纪日本发明的,因此 通常被称为日本蜡烛图(对于那些对其历史感兴趣的人来说,它们是由一个叫史蒂夫·尼森 (Steve Nisson) 的家伙在西方推广的。
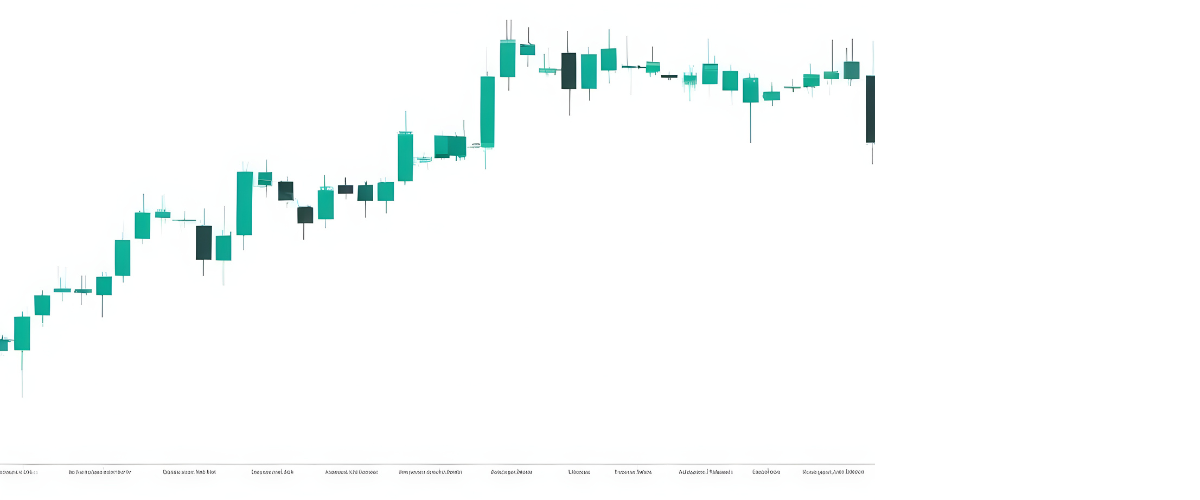
首先看图表,我们可以看到每根k线 讲述当时黄金价格的故事。下面让我们仔细看看其中的两个。

需要注意什么
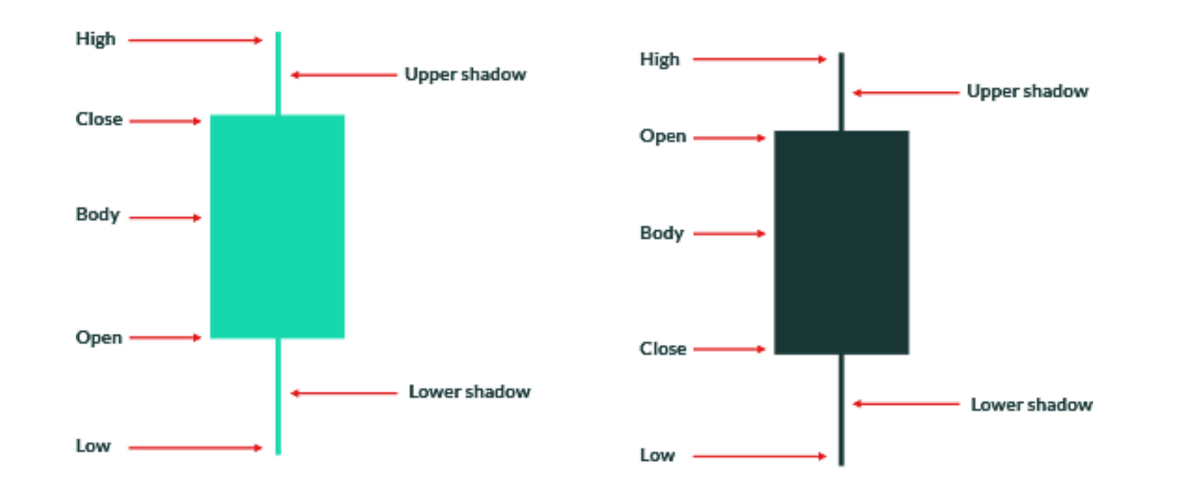
- 这 垂直线显示最高价格(在k线顶部)和 最低价(k线的底部,也称为 '灯芯')。
- 这
k线的颜色表明市场走向
价格下跌。深色k线表示价格下跌,而浅色蜡烛表示价格下跌。
k线显示价格上涨。
- 这
开盘价和收盘价由“主体”的边缘显示
k线。这可以帮助您了解市场的波动性。长线
实体显示开盘价和收盘价有很大差异
因此市场波动很大,而短实体则表明市场波动不大
价格走势。


蜡烛图的形态和图案多种多样, 它们所形成的蜡烛图也可能预示着趋势的变化或延续。
有些k线图形态提供了很多信息 因为他们自己,所以交易者会更加关注它们。下面我们列出了一些 更知名的阵型,但请参阅Skilling的其他部分 交易文章以获得更多。

1. 十字星
当蜡烛的开盘价和收盘价完全相同或几乎相同时,就会形成十字星。这意味着买家和卖家之间存在显着的平等。它经常出现在反转区域,例如支撑位和阻力位或趋势的底部或顶部。需要强调的是,十字星蜡烛本身并不意味着反转,而是意味着市场犹豫不决。十字星在交易者中非常受欢迎。
2. 长腿十字星
长腿十字星的上尖和下尖的长度几乎相等。这种十字星表示价格在指定时间范围内波动很大,但最终结果与最初开盘价相比变化不大。
3. 蜻蜓十字星
蜻蜓十字星是一种开盘价和收盘价位于柱线高位的十字星。其形状类似“T”,表示卖家占主导地位,但买家将价格推回到开盘价。
4. 墓碑十字线
墓碑十字线形成于开盘价、最低价和收盘价 相等,最高点形成较长的上影线。k线看起来像一个 倒“T”,表明买家主导卖家, 推动价格回到开盘水平。

长影蜡烛图
记住,上影线或下影线较长的蜡烛图表明交易时段中买方或卖方占主导地位。这两种形态都可能凸显价格可能出现逆转。
锤子
锤子线的主体较小,下影线较长,上影线较短。下尖峰较长意味着卖家压低了价格,但买家进入市场并推高了价格。锤子的低点表明卖家仍在市场中。这是一种看涨反转形态。此外,锤子线可以标记底部或支撑位,有助于设置止损位。

锤子线和倒锤线是交易者用来识别市场潜在反转点的常见形态。这些形态的形状非常相似,但它们有一个主要区别:
阅读此处。
流星
射击之星的主体较小,上影线较长,下影线较小。这些蜡烛图指向潜在的看跌反转或阻力位,但需要确认后才能采取行动。射击之星蜡烛图之后形成的蜡烛图确认了射击之星蜡烛图。

如何使用蜡烛图分析股票
投资者经常使用k线图来跟踪股票的表现。每根k线代表股票在一定时期内(通常是一天)的价格走势。k线由一根烛身和两根烛影组成,烛身代表股票的开盘价和收盘价,烛影代表该时期内达到的最高价和最低价。蜡烛图可以是 看涨或 看跌,具体取决于股票收盘价高于还是低于开盘价。
例如,AMC Entertainment Holdings (AMC)的看涨k线图显示股价在当天上涨,而 GameStop (GME)的看跌k线显示股价在当天下跌。k线图可以让投资者快速了解股票的表现,并可用于做出买入或卖出决定。
概括
日本蜡烛图是技术分析的另一个重要组成部分。许多提供图表的交易平台默认选择蜡烛图作为查看价格走势的方式。虽然还有许多其他可视化图表的方式,例如常规条形图,但我们 Skilling更喜欢k线。
然而,必须指出的是,许多其他交易者使用各种不同的方法,因此您可以自行决定使用哪种方法最为合适,哪种方法可以为您提供您需要(或不需要)的信息。无论哪种方法,您都会在某个时候遇到蜡烛图,因此对蜡烛图有所了解绝对是个好主意。


