


Average True Range (ATR) is a simple but very popular indicator designed to identify market volatility. It was also developed by J. Welles Wilder in his 1978 book, ‘New Concepts in Technical Trading Systems’. Unlike most, this indicator will not provide traders with entry points.
What ATR is designed to do is provide an indication of the volatility of the market they are trading. Knowing the level of volatility is perhaps most useful when it comes to determining your take profits and stop losses (cross-links). It’s ability to do this has made it one of the most popular tools for traders.
To calculate the ATR, Wilder broke out his concept into the True Range (TR) and then the Average True Range. To get the TR initially, you take whichever of the following calculations is greater on your chosen timeframe:
- High - Low
- High - Previous Close
- Low - Previous Close
From these figures, you will have a string of numbers and you can get your final Average True Range for the specified period by then doing the following calculation (we are assuming here daily bars/data):
Current ATR = ((Prior ATR x 13) + Current TR) / 14
- Multiply the previous 14-day ATR by 13.
- Add the most recent day's TR value.
- Divide the total by 14.

ATR reveals information about how volatile the market is, with above average values indicating high volatility and below average values indicating low volatility. This is especially true at the beginning of a market-move.
Usually traders use ATR to manage the positions based on how the market volatility changes. The greater the ATR is on a specific instrument, the wider the stop losses and take profits that could be used. Conversely, if the ATR has a lower value, the stop losses and take profits could be reduced to make them fit more accurately the state of the market at that time. Traders can use shorter or longer timeframes based on their trading preferences.
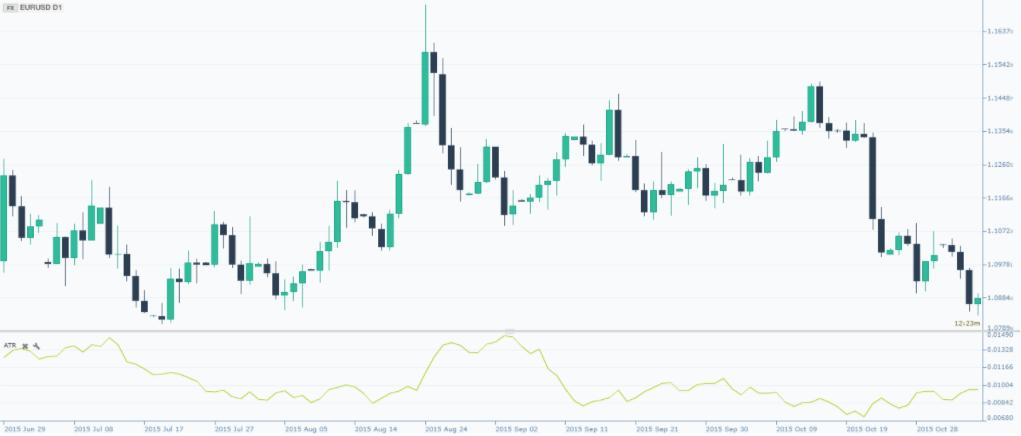
You can easily add this indicator to your Skilling trading platform. You just need to type in ATR to the indicator drop down menu. Here you can also change the colours, as well as the input data (longer or shorter time frames for example). The indicator will be shown in an additional window below the price chart.
Skilling Summary
The Average True Range is a very unique indicator and that has made it extremely popular. This is due to the fact that, despite not providing any entry signals at all, it gives traders an insight into an area that many forget or don’t pay enough attention to; volatility. Knowing the volatility of a market is extremely important.
Not only can you then decide on whether that particular market is suitable for your style, but if you do decide to move ahead with a trade, it can help you determine the size of your take profits or stop losses. This is a massive part of good risk management. Therefore, we definitely recommend the study of ATR and using it in your analysis - it will probably be most helpful on daily bars, to give you a good view of recent volatility before you pull the trigger!
不是投资建议。 过去的表现并不保证或预测未来的表现。


