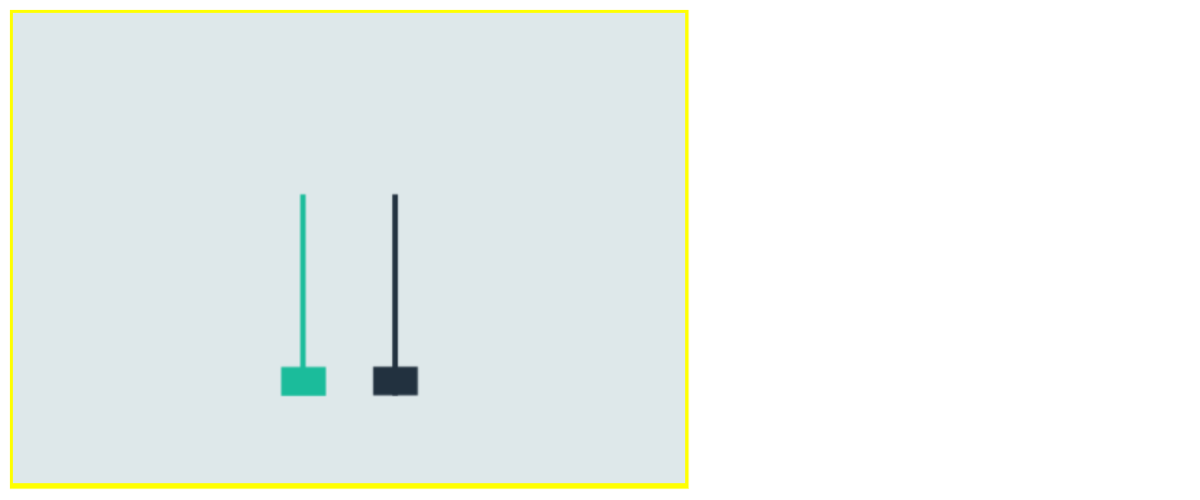
The hammer candlestick is a popular and powerful pattern used by traders to identify potential market reversals. By mastering the hammer candlestick pattern, traders can gain valuable insights into potential market reversals and enhance their trading strategies.
In this article, we will delve into what a hammer candlestick is, provide examples, discuss its types, and examine the pros and cons of using this pattern in trading. We will also highlight the benefits of trading online with an award-winning platform.
What is a hammer candlestick?
A hammer candlestick is a single candle pattern that signals a potential reversal in a downtrend. It is characterized by a small body at the top of the candlestick and a long lower shadow, which should be at least twice the length of the body.
The upper shadow is either nonexistent or very small. This formation indicates that despite selling pressure during the period, buyers managed to push the price back up, signaling potential bullish momentum.
Practice with a Demo Account
Try our demo account and experience real market conditions.
71% of retail CFD accounts lose money.

Example of hammer candlestick
To better understand the hammer candlestick, let's consider an example:
Suppose the stock of Company XYZ has been in a downtrend and is currently trading at $50. On one trading day, the price drops to $45 but then recovers to close at $48.
The resulting candlestick has a small body (the difference between the opening and closing prices) and a long lower shadow (the difference between the low of the day and the closing price).
This pattern suggests that although there was significant selling pressure pushing the price down to $45, the buyers stepped in and pushed the price back up to $48, forming a hammer candlestick. Traders might interpret this as a potential signal that the downtrend is losing momentum and a reversal could be imminent.
Types of hammer candlestick
There are two main types of hammer candlesticks, each indicating potential reversals but in different market conditions:
Bullish hammer: A bullish hammer appears at the bottom of a downtrend. It has a small body at the top with a long lower shadow, indicating that buyers have taken control after a period of selling pressure. This type of hammer is a strong bullish reversal signal.

Inverted hammer: An inverted hammer also appears at the bottom of a downtrend but has a small body at the bottom with a long upper shadow. This pattern indicates that buyers tried to push the price up but faced selling pressure, though the appearance of this candle still suggests a potential reversal.

Why miss out on the commodities market's potential?
Discover the untapped opportunities in top traded commodities CFDs like gold, silver & oil.
71% of retail CFD accounts lose money.

Pros and cons of hammer candlestick
| Pros | Cons |
|---|---|
| Clear reversal signal: Hammer candlesticks provide a clear and straightforward signal of a potential market reversal, making them easy to recognize and act upon. | False signals: Like all technical patterns, hammer candlesticks can produce false signals, particularly in volatile markets. |
| Versatility: This pattern can be used across various markets, including stocks, Forex, and commodities. | Confirmation needed: It is often advisable to wait for confirmation (such as a subsequent bullish candle) before acting on a hammer signal to avoid potential losses. |
| Simplicity: The hammer candlestick is simple to identify and does not require complex calculations or indicators. | Time frame dependency: The reliability of hammer candlesticks can vary across different time frames, with longer time frames generally providing more reliable signals. |
Trade online with an award-winning platform
Trading online with a reliable and award-winning platform can significantly enhance your trading experience and success. Platforms like Skilling offer intuitive interfaces, advanced tools, and comprehensive resources to help traders make informed decisions. By leveraging the features of a top-tier platform, you can effectively analyze patterns like the hammer candlestick and execute trades with confidence.
For instance, understanding the value of gold can be crucial for making informed trading decisions when trading in the commodities market.
FAQs
1. What is a hammer candlestick?
A hammer candlestick is a pattern that signals a potential reversal in a downtrend, characterized by a small body and a long lower shadow.
2. What are the types of hammer candlesticks?
The main types are the bullish hammer and the inverted hammer, both indicating potential market reversals in a downtrend.
3. Why is the hammer candlestick important?
It provides a clear signal of a potential trend reversal, helping traders make informed decisions and capitalize on market changes.
4. What are the pros and cons of using hammer candlesticks?
Pros include clear signals, versatility, and simplicity. Cons include the potential for false signals, the need for confirmation, and time frame dependency.
5. Where can I trade using hammer candlesticks?
You can trade using hammer candlesticks on various platforms, including Skilling, which offers comprehensive tools and resources for effective trading.


