Access 1,200+ global CFDs instruments.
Access a plethora of trading opportunities across the financial markets.

Access 1,200+ global CFDs instruments.
Access a plethora of trading opportunities across the financial markets.

The diamond pattern is a notable reversal formation within trading charts that often indicates impending trend shifts. Recognized for its distinct diamond-like appearance, this pattern is relatively rare yet serves as a potent signal, frequently appearing at critical market peaks and troughs.
In the realm of technical analysis, the diamond pattern signifies potential reversals or continuations in market trends. This comprehensive guide delves into its fundamental aspects, the various types, practical trading examples, along with the advantages and disadvantages associated with using this pattern.
What exactly is the Diamond Pattern?
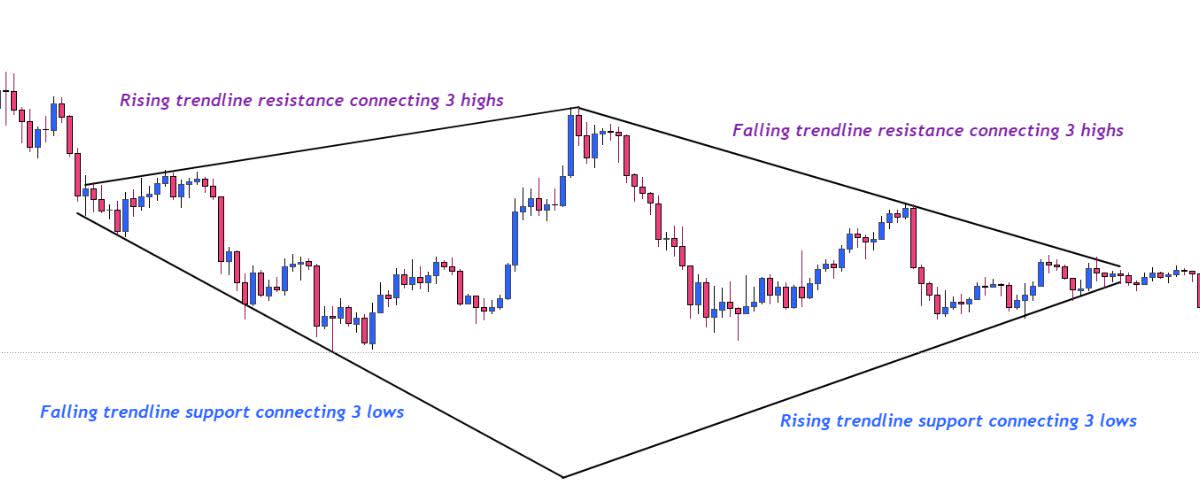
The diamond pattern, aptly named for its resemblance to the gem, consists of a specific technical chart formation characterized by four distinct price movements that create a diamond shape. These movements are comprised of two ascending peaks and two descending troughs, with trendlines connecting them to form the diamond’s outline. Traders utilize this pattern to pinpoint possible reversals or continuations in trends based on their specific formation and the market context.
Example of a Bearish Diamond Pattern

Illustration created using TradingView
This pattern is primarily categorized into two types: the bearish diamond top and the bullish diamond bottom. The bearish diamond top indicates a potential transition from an upward trend to a downward trend, whereas the bullish diamond bottom suggests a potential shift from a downward trend to an upward trend.
Types of Diamond Patterns
The diamond pattern plays a crucial role in trading, serving as a key indicator for significant trend reversals. A deep understanding of its implications equips traders with a strategic advantage in navigating the intricate dynamics of various markets.
Practice with a Demo Account
Try our demo account and experience real market conditions.

There are two main types of diamond patterns:
- Bearish Diamond Top: This formation appears to follow an upward trend and signifies a possible shift toward a downtrend. It is characterized by a sequence of price fluctuations that resemble a head and shoulders pattern but consolidate in a diamond shape.
- Bullish Diamond Bottom: This pattern occurs after a downward trend, signaling a potential transition toward an uptrend. It mirrors an inverted head and shoulders formation, where price movements create the diamond outline.
Each variant carries its distinct characteristics and trading signals, reflecting the ever-changing nature of market dynamics. By grasping these patterns, traders can enhance their analytical capabilities, improving their ability to predict market trend shifts with increased precision.
Practical Trading Example:
Consider encountering a descending diamond pattern on the EUR/USD chart. The presence of lower highs and higher lows could imply a weakening downtrend. If a confirmed breakout occurs beneath the lower trendline, accompanied by rising trading volume, it may signal a potential bearish continuation, presenting a short-selling opportunity.
The Advantages and Disadvantages of the Diamond Pattern
| Advantages | Disadvantages |
|---|---|
| Indicates Significant Trend Reversals : The diamond pattern often signifies notable shifts in market trends, which can be advantageous for traders looking to capitalize on price movements. | Rarity and Difficulty in Identification : The diamond pattern is infrequently encountered, making it challenging to identify consistently. |
| Applicable Across Various Markets and Timeframes : This pattern can be utilized in a wide array of markets and across different timeframes, providing flexibility to traders. | Potential for False Signals : Like many chart patterns, the diamond formation may occasionally produce misleading signals, prompting caution. |
| Provides Clear Entry, Stop Loss, and Profit Targets : The defined structure of the diamond pattern enables traders to set precise entry points, stop-loss levels, and profit targets, enhancing their trading strategy. | Requires Confirmation with Other Analytical Tools : To increase reliability, traders should use the diamond pattern in conjunction with other technical analysis tools. |
Curious about Forex trading? Time to take action!
Use our free demo account to practise trading 70+ different Forex pairs without risking real cash.

Summary
The diamond pattern is notable for its infrequency and the significant trend reversals it may predict. Whether it manifests as a bearish diamond top signaling a downturn or a bullish diamond bottom suggesting an upward shift, each pattern plays an integral role in a trader's toolkit. Mastery of these patterns demands patience, keen observation, and ongoing practice. As traders become proficient in recognizing and interpreting these formations, they open doors to new opportunities for lucrative trades.
It’s essential to remember that the diamond pattern, with its unique characteristics and implications, transcends a mere trading signal; it symbolizes the intricate interplay of supply and demand dynamics in the market.
Frequently Asked Questions (FAQs)
1. Can I trade diamond patterns in any timeframe?
Yes, diamond patterns can appear in any timeframe, providing traders with versatility. However, they tend to be more reliable in longer timeframes due to a decreased likelihood of false signals.
2. Are diamond patterns reliable?
While diamond patterns are among the more reliable indicators for reversals, no pattern can guarantee absolute accuracy. Traders should use them alongside other analytical tools for informed decision-making.
3. Which diamond pattern offers the highest profit potential?
Every type possesses its potential for profitability, but successful trading hinges on proper identification, confirmation, and robust risk management strategies.
4. Are there specific indicators that complement diamond patterns?
Utilizing volume analysis or additional technical indicators alongside diamond patterns can enhance trading signals, improving decision-making.
5. Can diamond patterns be utilized independently for trading decisions?
No, they should be integrated into a comprehensive trading strategy that incorporates other analytical methods and risk management techniques.


