
What is Parabolic SAR and how does it works?
-
 Skilling Writers Team
-

-

- Education
- Trading


What is Parabolic SAR?
The Parabolic SAR, a technical indicator used by many traders, was developed by Welles Wilder who introduced the system in his book, ‘New concepts in Technical Trading Systems’ in 1978. SAR stands for ‘Stop and Reverse’, which arises when the indicator stops and reverses causing the price to break above or below the indicator.
What does it look like?
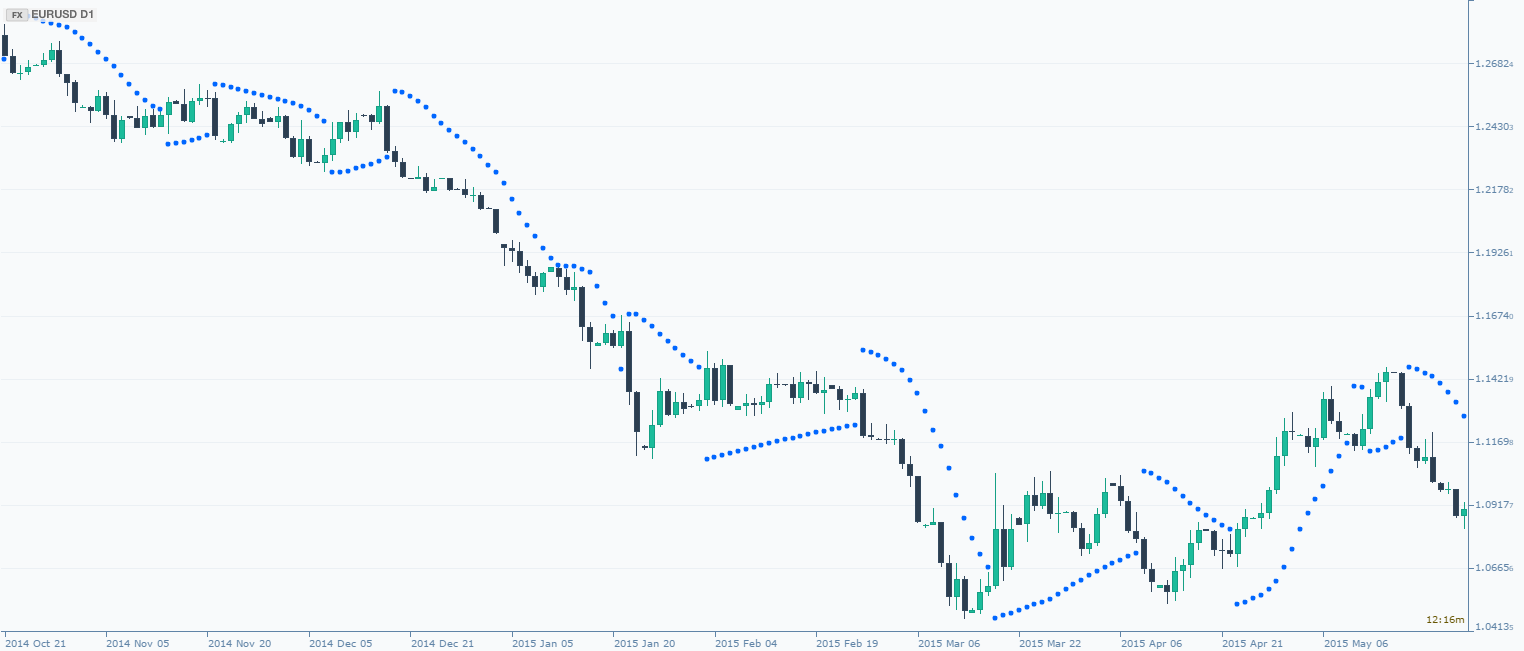
The Parabolic SAR indicator is graphically shown on the chart as a series of dots placed either above or below the price. A small dot is placed below the price when the trend of the instrument is upward, while a dot is placed above the price when the trend is downward. As the price movement comes to an end, the indicator moves steadily closer to the price until it ends up touching the dots. Have a look at the pictures below to get a better understanding.
Trade Demo: Real trading conditions with zero risk
Trade risk-free on Skilling’s award winning platforms with a 10k* demo account.
71% of retail CFD accounts lose money.

Trend following
Parabolic SAR is considered as a trend following indicator. The dots that are plotted are used by many traders as a trailing stop loss level with the goal of protecting and locking in profits which is an important part of many traders’ strategies.
Parabolic SAR works very well in trending markets and can provide accurate entry signals and exit points. Based on Wilder’s estimates, the market is trending only 30% of the time so traders usually use this indicator with oscillating indicators also, like ADX, RSI or MACD.
A Parabolic SAR trading strategy is rather simple; go long if the price moves higher; and short if it goes below. The stop loss can be placed on the previous dot and trailed, as the price moves and the next dot appears. Because it provides trend following signals we do not need to place take profits because our position will stop out once it hits the trailing stop loss.
To add this indicator to your Skilling platform, you just need to type in Parabolic SAR to the indicator drop down menu, and choose it. You may set up the colours as well as change the input data and although it might look complicated at first, as we have now seen it’s actually quite a basic indicator.
Skilling Summary
The Parabolic SAR is different to many indicators as its main benefit is not providing entry signals (although it does do this as well), but in providing exit signals. As some traders can have difficulty in knowing where to place their stop losses, especially at the start of their trading careers, we believe it may offer a very useful tool to let traders gain experience on this key part of risk management. Whilst the indicator when first plotted can look complicated, as outlined above, it doesn’t take long to get used to it. We believe therefore, it is a highly useful method for all traders to be familiar with.
Not investment advice. Past performance does not guarantee or predict future performance.


