
Moving Averages & SMA Trading: 2025 Guide
-
 Skilling Writers Team
-

-

- Trading
- Education


What is a moving average?
A moving average is more than just a line on a chart; it's a powerful tool that traders use to analyze and interpret market trends. By understanding what a moving average is and how it functions, traders can gain insights into market behavior and make more informed decisions
- Definition: A moving average is a statistical tool used in trading to smooth out price data over a specified period, helping to identify trends.
- Function: It calculates the average price of a security over a set number of periods, providing a constantly updated average price.
- Types: There are several types of moving averages, with the Simple Moving Average (SMA) and Exponential Moving Average (EMA) being the most common. In essence, a moving average simplifies the price data to allow traders to see the overall direction of a security's price movement, making it a cornerstone in technical analysis.
Moving Averages are a key part of technical analysis, and a concept that should be learnt by all traders. They are designed to help you spot the trend of any instrument you may be trading and are based on using the price changes of the underlying asset, to create an informative line on a chart. This line can help you make numerous trading decisions and is a vital companion to successful trading. Moving Averages (MA’s) also form the basis of many other, more advanced, technical tools - so their importance cannot be understated.
To get started, it is helpful to understand the basic trait of MA’s, these being that a long-term average (say a 200-day average) is slower to react to underlying trends than a short-term average (say a 50-day average). This is the key to understanding Moving Averages.
Simple moving average (SMA) in trading
The Simple Moving Average (SMA) is a key variant of moving averages, offering a straightforward approach to understanding market trends. Its simplicity in calculation and interpretation makes it a favorite among traders.
- SMA explained: The Simple Moving Average (SMA) is calculated by taking the arithmetic mean of a set of prices over a specific number of days or periods.
- Usage: SMA is used to identify support and resistance levels, trend direction, and potential reversal points in the market.
- Example: A 50-day SMA is often used to gauge the medium-term trend, while a 200-day SMA is used for the long-term trend.
Simple Moving Averages smooth the price data of any instrument to form a trend following indicator. It is done by calculating the average price of an instrument over a specific number of periods. Usually the Simple Moving Average is based on the closing price.
Let’s say you want to work out the 10-day Simple Moving Average for Gold. To do that, you’d look up the closing price for gold over the past 10 days, add them together, and then divide by 10. This will give you only the 10-day average. But as a Moving Average is an average, it therefore naturally moves as old data is dropped and as new data comes available.
In other words, the first day of the Moving Average covers the last 10 days, while the second day of the moving average drops the first data point and adds the new data point. The following days continue by dropping the latest data and adding the new data. Below you can see the SMA10 on a chart of daily Gold prices.
Trade Demo: Real trading conditions with zero risk
Trade risk-free on Skilling’s award winning platforms with a 10k* demo account.

Exponential Moving Average (EMA)
It’s very similar to a Simple Moving Average except there is more weight on the latest data. EMA reacts quicker than the SMA, which means that it turns before the SMA so it's more sensitive to recent prices.
To determine the EMA, you need to use the SMA as the starting point of your EMA calculation. Then you also need to calculate the weighting multiplier by applying this formula:
(2 / time periods + 1).
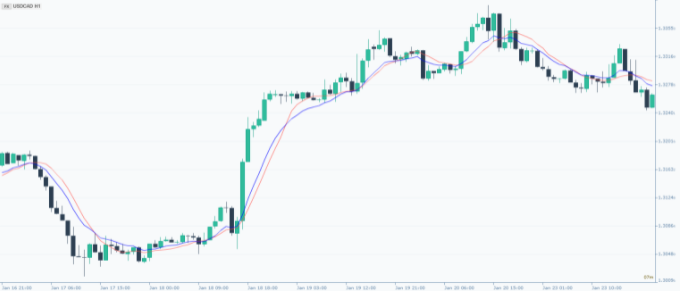
Taking the previous example, if you want to determine a 10-day EMA, you will get 0.1818 (18.18%) as a multiplier by using the above-mentioned formula (2 / 10 + 1). And then you can calculate the Exponential Moving Average with the formula below: EMA = ((daily closing price - EMA (previous day)) x multiplier + EMA (previous day)) Don’t forget EMA starts with SMA, so when you are applying the previously mentioned EMA formula, at the first calculation you need to replace EMA (previous day) with SMA (previous day). Whilst this may appear confusing at first it is actually very simple to visualise on a chart.
To compare the SMA and EMA see the chart above.
- Blue = EMA
- Red = SMA
Interpretation of Moving Averages
Moving Averages (both simple and exponential) can be useful if you want to identify the trend direction by using one particular Moving Average, or if using more than one, by observing any crossovers of MA’s.
If you want to use a Moving Average for trend identification, you need to watch whether the price is below or above the Moving Average. If the price is above and the Moving Average is rising, it shows prices are generally increasing. If the price is below and the Moving Average is falling, it reflects that the prices are generally decreasing.
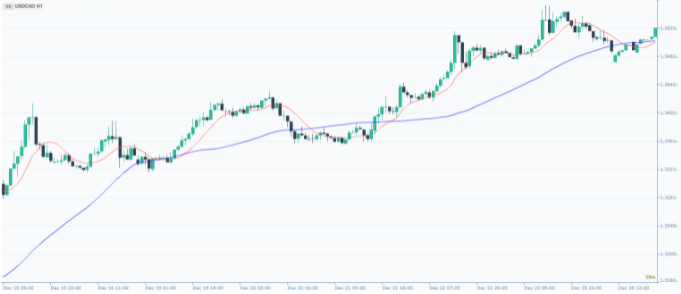
Crossovers of Moving Averages can help you to determine shifts in momentum and also provide perhaps the most basic signals for entries and exits. This occurs when the two Moving Averages (one shorter-term and one longer-term) cross each other. For example: if a short-term Moving Average moves upwards through a long-term one, that’s a sign that prices could continue heading up. If the short-term average comes down through the long-term average, it could be a sign that prices are about to tumble. Please find below an example for the SMA crossovers.
- Blue = SMA50
- Red = SMA10
In addition, some traders believe that MA’s (especially SMA’s) also act as support or resistance levels. Their belief, is that if the price is getting close to the MA, there can be a reversal of the trend. Usually, the 20, 50, 100 and 200 period SMA’s are most perceived to act as support or resistance levels, and hence these are the most popular ones.
Setting up MA in your Skilling platform
The set-up interfaces of SMA and EMA are the same. You can adjust the following:
Period: More common Moving Averages are 14, 21, 50, 100 or 200 days.
Type of price: ‘Close’, ‘Open’, ‘Low’ or ‘High’.
Applying SMA and moving averages in market analysis
Applying Simple Moving Averages (SMA) and other moving averages in market analysis is a skill that can significantly enhance a trader's ability to read and react to market dynamics. These tools, when used effectively, can offer a window into the market's intensity.
- Trend identification: Moving averages help traders identify the direction of the trend. An upward trending moving average indicates an uptrend, while a downward trending moving average suggests a downtrend.
- Crossovers: Traders often look for crossover events, where a short-term moving average crosses above or below a long-term moving average, signaling potential entry or exit points.
- Limitations: While useful, moving averages should be used in conjunction with other indicators and analysis methods for more accurate trading decisions.
Incorporating moving averages into market analysis is a strategy that, when mastered, can provide a significant edge in navigating the complexities of the financial markets
Skilling Summary
Moving Averages are an absolutely vital part of technical analysis. In fact, we would go so far as to say that this is a top area to learn and master from the Skilling trading articles! If you are new to trading, you re-read the article and then really start to play around with all the various types of Moving Averages on the Skilling platform. You will find the basics to many strategies used by novice to professional traders across the globe. They form one of the key basic components of all technical analysis.
FAQs
How does SMA differ from other types of moving averages?
SMA provides a simple average of prices over a specified period, while other types like EMA give more weight to recent prices, making them more responsive to new information.
What role does SMA play in identifying market trends?
SMA helps in smoothing out price fluctuations, making it easier to identify the underlying trend. A rising SMA indicates an uptrend, while a falling SMA suggests a downtrend.
What is the primary purpose of using a moving average in trading?
The primary purpose of using a moving average is to smooth out price data to identify and confirm trends, reduce market noise, and provide a clearer view of the market's direction.
Can moving averages predict future market movements?
A: While moving averages can provide insights into market trends, they are based on past data and do not predict future market movements. They should be used as part of a broader analysis strategy.
How do traders choose the right period for a moving average?
The choice of the period for a moving average depends on the trader's strategy and the market being analyzed. Shorter periods are more responsive to price changes, suitable for short-term trading, while longer periods provide a clearer view of long-term trends.
Are moving averages more effective in certain market conditions?
Moving averages are generally more effective in trending markets where a clear direction is established. In sideways or ranging markets, they may produce false signals.
How does the Simple Moving Average (SMA) differ from the Exponential Moving Average (EMA)?
The main difference is in the calculation. SMA gives equal weight to all prices in the period, while EMA gives more weight to recent prices, making it more responsive to recent price changes.
Can moving averages be used for all financial instruments?
Yes, moving averages can be applied to any financial instrument with price data, including stocks, forex, commodities, and indices. They are versatile tools in various market conditions.
Is it advisable to use moving averages alone in trading decisions?
While moving averages are powerful tools, relying solely on them for trading decisions is not advisable. They should be used in conjunction with other technical indicators and fundamental analysis for a more comprehensive market view.
Ready to take your trading game up a notch?
Our trading app is here to give you all the tools and guidance you need, no matter your experience level.

Not investment advice. Past performance does not guarantee or predict future performance.


