Is it better to trade with indicators or without them?

This question is one of the most frequent in seminars and trading related spaces.
It is not only formulated by those who start in trading, but also by people who are already trading and reach that moment of uncertainty that we all go through. Traditionally it has been understood that someone, with no previous experience in trading, should rely on some objective tool.
In this way, it eliminates the "nose" effect that so many accounts have destroyed. The nose effect is that conviction, based on a simple hope, that the market will now focus in the sense envisaged by one. Unfortunately, that quality is only obtained with a long experience and is always limited, without a guarantee of success.
That is why the application of tools to predict the movement of asset prices is so widespread, the famous "technical indicators". The basis of its use is the premise that the market has "memory". That is, it repeats behaviours over time.
From there, some tools are easily identified among others:
- Supports and resistances
- Bullish or bearish channels
- Chartist figures: double ceiling or double floor, pennants, triangles, shoulder-head-shoulder, cup with handle
- Over-buy and over-sell oscillators
- Elliott waves
- Pivot points
- Harmonics
And so many other systems that rely on a repetitive price movement over time to reveal signals of entry (and exit) of the market. Starting from this premise, it is certainly logical to rely on these elements of prediction of the future behaviour of financial assets.
But two approaches must be taken into account:
- They are not magical, if the market behaves as the indicator predicts, it is not because there is a hidden force of the universe that leads it according to what that indicator marks.
- They work frequently because many people use them in the same way and therefore, similar behaviours are generated by repetition of conducts, which makes the indicator in question seem miraculous.
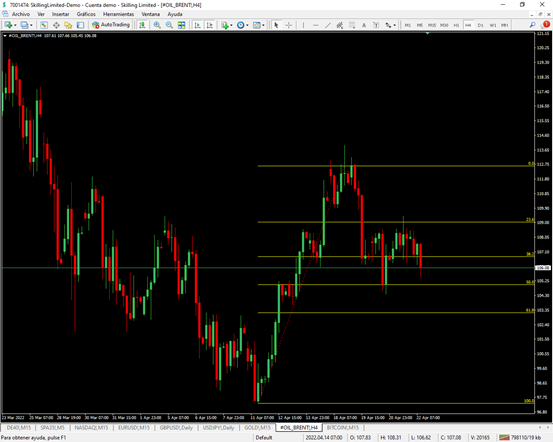
Oil Brent, 4-hour candlesticks, with Fibonacci Retracement indicator, Skilling MT4 Platform
For example, in the image we can see the Fibonacci Retracement marking the levels that, after a relevant boost, the market usually looks for in its return (or retracement).
It seems magical, right? But the truth is that many investors and traders have those ranges in their trading systems and react when prices reach them.
Hundreds of thousands of automatic trading systems have also been programmed to take Fibonacci into account in their automatic trading. And that's why it seems to work.

But they are neither magical nor do they always work. They are simply tools to support the trader, who must exercise his maximum sense of caution with his positions, measuring risk at all times.
And yet, they are quite valid. That is why it is better to trade with them, particularly at the beginning of the trading life.
Now, the second most common question:
And if I use them, which are the most effective?
Here there are several opinions, such as the schools of philosophy in Ancient Greece. In my opinion, the most effective are... those that are effective for you.
You have to test them one by one (a small selection, because there are thousands and thousands of them) and do backtesting, to check their effectiveness.
The importance of backtesting is enormous, since it allows us to analyze the result of the signals that an indicator or an expert puts in front of us, without having to wait for the future evolution of prices to develop.
Trade Demo: Real trading conditions with zero risk
Trade risk-free on Skilling’s award winning platforms with a 10k* demo account.

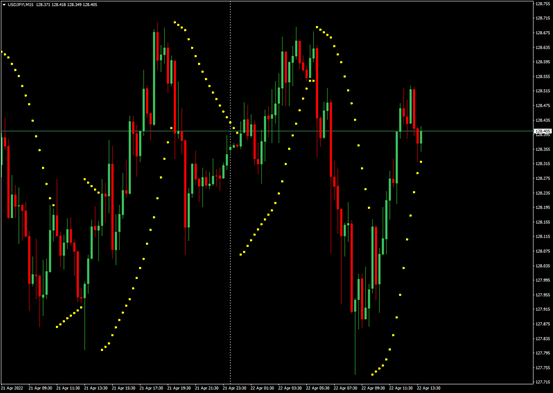
USDJPY in 15-minute candlesticks with Parabolic SAR indicator, Skilling MT4 Platform
Each trader will have his preferences, the parabolic SAR or Supertrend, or the RSI or MACD, etc. But let the choice not be because it looks prettier on the chart or because it is nailing the levels in the last three days. Backtesting is the key.
Finally, as I indicated above, the most effective indicator is the one that is for each trader.

Not investment advice. Past performance does not guarantee or predict future performance.


