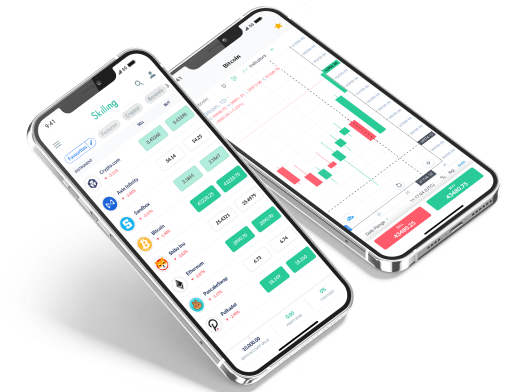
CFD-trading is all about timing, discipline, and making decisions based on more than just instinct. One of the most valuable tools available to CFD traders is technical indicators — data-driven formulas applied to price charts that help identify trends, momentum, and potential reversal points. Used correctly, they can add structure and precision to your trades.
In this article, we’ll look at what technical indicators are, how they work, and how to apply them within your CFD-trading strategy across markets like forex, indices, commodities, and crypto.

What Are Technical Indicators?
Technical indicators are mathematical calculations based on price, volume, or open interest. They are used to analyze historical price data and forecast potential future movements. Indicators don't guarantee success, but they give traders a way to make decisions rooted in logic instead of emotion.
There are four main types of indicators:
- Trend indicators (e.g., Moving Averages)
- Momentum indicators (e.g., RSI, MACD)
- Volatility indicators (e.g., Bollinger Bands)
- Volume indicators (less common in CFD-trading, more used in equities)
Key Indicators CFD Traders Use
1. Moving Averages (MA)
These help smooth out price fluctuations and identify the overall direction of a market.
- The Simple Moving Average (SMA) gives equal weight to all data points.
- The Exponential Moving Average (EMA) gives more weight to recent data.
Crossovers between short-term and long-term MAs (e.g. 20 EMA crossing above 50 EMA) often signal entry or exit points.
2. Relative Strength Index (RSI)
The RSI measures momentum and identifies overbought or oversold conditions.
- RSI above 70 = overbought
- RSI below 30 = oversold
It’s ideal for spotting potential reversals, especially in ranging markets.
Experience Skilling's award-winning platform
Try out any of Skilling’s trading platforms on the device of your choice across web, android or iOS.
71% of retail CFD accounts lose money.

3. MACD (Moving Average Convergence Divergence)
MACD combines trend and momentum. When the MACD line crosses above the signal line, it may indicate a bullish trend, and vice versa. It’s especially useful in trending markets.
4. Bollinger Bands
These use a moving average and standard deviations to define upper and lower bands. When price touches or breaks the outer bands, it may suggest increased volatility or potential breakout/reversal setups.
Combining Indicators for Better Accuracy
Many traders combine multiple indicators for confirmation:
- Example: Use a trend indicator (like a 50 EMA) to define direction and a momentum indicator (like RSI) to time the entry.
- Avoid "indicator overload." Two to three well-chosen tools are often more than enough.
Why miss out on the commodities market's potential?
Discover the untapped opportunities in top traded commodities CFDs like gold, silver & oil.
71% of retail CFD accounts lose money.

Mistakes to Avoid
- Chasing every signal: Not every crossover or RSI dip is trade-worthy. Context is key.
- Lagging interpretation: Most indicators reflect past price action. They are tools, not predictions.
- Overcomplication: Keep your chart clean and readable. Complexity doesn't equal better performance.
Final Thought
Technical indicators give structure to your CFD-trading. Used with clear rules and good risk management, they help remove emotional bias and support smarter decisions.


